Financial RSS Feeds
https://www.investing.com/rss/news.rss
https://cointelegraph.com/rss

Bitcoin posted its strongest daily gain since May as buy-side flows, a sharp adjustment in investor sentiment and a return of the Coinbase premium hint at a potential rally above $100,000.

Select users in the US will be among the first to access the predictions platform to bet on sports event contracts, following clearance from a financial regulator for a relaunch.
https://www.coindesk.com/arc/outboundfeeds/rss/
https://cryptobriefing.com/feed/
The SKR token launch could significantly enhance Solana Mobile's ecosystem, fostering innovation, security, and community engagement.
The post Solana Mobile plans to launch SKR token in January 2026 appeared first on Crypto Briefing.
Schwab's potential crypto acquisitions could reshape the brokerage landscape, intensifying competition and accelerating mainstream crypto adoption.
The post Charles Schwab open to crypto acquisitions if pricing makes sense, says CEO appeared first on Crypto Briefing.
https://bitcoinist.com/feed/
Over the past few weeks, the price of Ethereum has been on a downward trend due to a highly volatile market environment. ETH’s bearish action appears to have hampered on-chain activities, as evidenced by a decline in its total transactions carried out within a monthly period.
A Quiet Month For The Ethereum Network
Ethereum’s on-chain activity appears to have slowed down alongside the ongoing decline of ETH’s price. The blockchain, which is typically bustling with contract calls, exchanges, and transfers, now feels a little more roomy, suggesting a cooling pulse beneath the surface.
After examining the Transactions on the Ethereum Network metric in the monthly time frame, Everstake.eth, a market analyst and the head of the ETH segment at Everstake, revealed that the blockchain has recorded its worst month of the year. While price has declined, ETH’s total transactions executed in a month, particularly November, experienced a cool-off.
According to the data, the overall number of transactions carried out on the Ethereum network in November alone was approximately 32.2 million. Although this figure may seem large, it actually marks the lowest monthly count in the past 12 months.
Such a drop in transactions may suggest the renewed waning appetite for the network. In addition to suggesting a retreat, this delay reads more like a collective pause as users catch their breath, procedures recalibrating, and the market adjusting to its new rhythm.

Everstake.eth highlighted that this kind of cooldown usually occurs when the market moves into a wait-and-see phase. During this phase, capital is observed sitting on the sidelines while developers continue to build on the blockchain. Despite this trend, the network still records more than 33 million transactions in a quiet month, which reflects its robust strength.
At a time like this, the expert noted that user behavior typically follows the market sentiment. As seen in the past, on-chain activity tends to cool down when volatility drops. However, Ethereum still retains the status as the most reliable network even during slow phases.
With the Fusaka Upgrade set to hit the market, Everstake.eth predicts that ETH transactions will see explosive growth. “If this is the worst month, imagine what the best will look like after Fusaka rolls out. It will be huge,” the expert stated.
ETH Active Transactions Pick Up
The monthly transactions may have slowed down, but the active addresses on the Ethereum network are heating up again. Leon Waidmann, the head of research at On-Chain Foundation, reported that active addresses throughout the entire ecosystem, Layer 1 and Layer 2s, bounced back above 9.5 million this week.
This surge points to a quiet resurgence of interest, utility, or a group readiness for the future. Waidmann highlighted that this marks the first meaningful reversal after several weeks of downside action.
ETH layer 2s such as Base, Arbitrum, Optimism, and World Chain have witnessed a strong rebound following a period of decline. Furthermore, multi-chain activity is starting to stabilize after the drop in Q3. These factors are painting a bullish picture for the network and its price prospects.
Since launching in mid-November 2025, institutional demand for XRP ETFs has climbed beyond the inflows recorded for the crypto market’s two largest assets, Bitcoin and Ethereum. The latest numbers show how quickly capital allocation has shifted, placing XRP at a defining advantage in an increasingly competitive market.
XRP ETFs Inflow Profile Establishes Category Leadership
The first wave of US spot XRP ETFs launched on November 13, led by Canary Capital’s XRPC, which opened with $243.05 million in first-day inflows and has since maintained consistent positive flows, frequently exceeding $100 million in single-day inflows. Across the four active issuers—Canary Capital (XRPC), Bitwise (XRP), Grayscale (GXRP), and Franklin Templeton (XRPZ)—cumulative net inflows have now surpassed $756 million, according to SoSoValue data.
Daily performance across the broader market has followed the same strong pattern. XRP ETFs saw $243.05 million in inflows on November 14, $118.15 million on November 20, and $164.04 million on November 24. By December 1, it secured another $89.65 million, reinforcing the steadiness of demand throughout the launch phase.
Together, these numbers place XRP ahead of every other non-stablecoin asset in ETF inflows over the same period. Independent reports also show that the category gathered $587 million within its first ten trading days, surpassing early benchmarks set by previous altcoin ETF rollouts—including those tied to Bitcoin and Ethereum.
Institutional Capital Flows Favor XRP Over Bitcoin And Ethereum
XRP ETFs’ inflow performance becomes even more pronounced when compared with contemporaneous Bitcoin and Ethereum ETF inflows. On December 1, Bitcoin ETFs recorded $8.48 million in net inflows—roughly one-tenth of XRP’s same-day figure. By contrast, Ethereum ETFs reported more than $79 million in net outflows, continuing a multi-week trend of capital rotation away from ETH-linked products.
This divergence underscores a clear reallocation dynamic in the US market. While Bitcoin and Ethereum remain the dominant assets by AUM, inflow velocity has shifted decisively. XRP’s ability to attract more cumulative net inflows than the leading two crypto assets—despite launching later and holding a smaller market capitalization—marks a material development in ETF-driven capital flows.
The launch sequencing provides additional clarity. Franklin Templeton’s XRPZ and Grayscale’s GXRP both delivered standout debuts, recording $62.6 million and $67.4 million in first-day inflows, respectively, marking the strongest ETF launches of 2025 to date. This surge contributed to a broader inflow cycle that added roughly $300 million across the XRP ETF ecosystem, propelling XRP into the top tier of crypto ETFs by net new capital, despite the underlying asset remaining below key price resistance levels.
Data from multiple independent trackers shows that XRP ETFs have recently recorded higher net inflows than Bitcoin and Ethereum ETFs. Across the tracked XRP ETF issuers, inflows have been consistently strong, indicating a notable shift in investor capital allocation among newly launched digital-asset ETFs.
https://cryptoslate.com/feed/
Anthropic’s Frontier Red Team spent the past year teaching AI agents to behave like professional DeFi attackers.
The agents learned to fork blockchains, write exploit scripts, drain liquidity pools, and pocket the proceeds, all in Docker containers where no real funds were at risk.
On Dec. 1, the team published results that should recalibrate how protocol developers think about security: when pointed at 34 smart contracts exploited on-chain after March 2025, frontier models including Claude Opus 4.5, Sonnet 4.5, and GPT-5 autonomously reconstructed 19 of those attacks, extracting $4.6 million in simulated value.
The agents had never seen write-ups of the vulnerabilities. They reasoned through contract logic, composed multi-step transactions across DEXs, and iterated on failed attempts until code execution succeeded.
This isn’t hypothetical, as these were real exploits that actually drained real protocols in 2025, and the agents figured out how to do it from scratch.
The economics are already viable
Anthropic ran GPT-5 against 2,849 recent BNB Chain ERC-20 contracts at a total inference cost of roughly $3,476, about $1.22 per contract. The agents uncovered two fully novel zero-day vulnerabilities worth approximately $3,694 in simulated profit.
The average cost per vulnerable contract identified was $1,738, with net profit around $109 per exploit at current capabilities.
That’s an upper bound. In practice, an attacker would prefilter targets by TVL, deployment date, and audit history before deploying agents, driving costs lower.
Token usage per successful exploit has already fallen by more than 70% over the past six months as models have improved.
The paper projects exploit revenue doubling every 1.3 months based on observed capability gains, a compounding curve that leaves little time for defenders operating on quarterly audit cycles.
One zero-day discovered during the scan shows how simple these vulnerabilities can be. Developers deployed a rewards token with a public “calculator” function that returns user balances. They forgot the “view” modifier.
Because the function could update state, anyone could repeatedly call it to inflate their token balance, then dump it into liquidity pools.
Anthropic estimated about $2,500 in extractable value at the snapshot block, rising to nearly $19,000 at peak liquidity.
The team coordinated with Security Alliance and a white hat to drain the contract and return funds before a malicious actor found it.
How the agents actually work
Each agent runs in a container with a forked chain node, Foundry for contract interaction, Python for scripting, and a Uniswap routing helper for composing swaps.
The agent reads contract source, queries on-chain state, edits exploit scripts, and executes transactions. A run passes if the agent ends with at least 0.1 more native token than it started with.
The agents don’t brute force. They analyze contract logic, identify state transitions that violate invariants, construct transaction sequences that trigger those transitions, and refine scripts when attempts fail.
GPT-5 and Opus 4.5 both chained flash loans, manipulated oracle prices via large swaps, and exploited reentrancy across multiple contracts in a single atomic transaction, techniques that require understanding both Solidity execution semantics and DeFi composability.
Many of the exploits agents reconstructed, reentrancy via untrusted external calls, access-control failures in mint functions, improper slippage checks, are mistakes that have plagued Solidity for years.
What changed is automation: where a human auditor might spend hours tracing execution paths, an agent spins up a forked node, writes a test harness, iterates on failed transactions, and delivers a working proof of concept in under 60 minutes.
Across Anthropic’s full benchmark of 405 real exploits from 2020 to 2025, 10 frontier models produced working exploits for 207 contracts, with simulated stolen funds totaling $550 million.
The vulnerability distribution follows a power law: in the post-March slice, two high-value contracts accounted for more than 90% of simulated revenue.
Fat-tail risk dominates, meaning the primary countermeasure isn’t finding every edge case but rather hardening the handful of vaults and AMMs that concentrate systemic exposure.
Three countermeasures that matter
Anthropic open-sourced SCONE-bench explicitly for defenders. Protocol teams can plug their own agents into the harness and test contracts on forked chains before deployment.
The shift is philosophical: traditional audits assume that humans review code once and file a report. Agentic testing assumes adversaries run continuous automated reconnaissance and that any contract with non-trivial TVL will face exploit attempts within days of deployment.
First, integrate AI-driven fuzzing into CI/CD pipelines. Every commit that touches financial logic should trigger agent-based tests on forked chains, hunting for reentrancy, access-control gaps, and state inconsistencies before code reaches mainnet. SCONE-bench provides the scaffolding, and teams supply the contracts.
Second, shorten patch and response cycles. The paper’s 1.3-month doubling time for exploit capability means vulnerabilities have shrinking half-lives. Pair AI auditing with standard DeFi safety mechanics, pause switches, timelocks, circuit breakers, staged rollouts with capped TVL.
If an agent can write a working exploit in under an hour, defenders need sub-hour detection and response loops.
Third, recognize that this extends beyond DeFi. Anthropic’s parallel work on AI for cyber defenders positions model-assisted exploitation as one front in a broader automation race across network security, CI/CD hardening, and vulnerability management.
The same agents that script smart-contract attacks can test API endpoints, probe infrastructure configurations, and hunt for cloud misconfigurations.
Who moves faster wins
The question isn’t whether AI agents will be used to exploit smart contracts, as Anthropic’s study proves they already can. The question is whether defenders deploy the same capabilities first.
Every protocol that goes live without agent-assisted testing is betting that human reviewers will catch what automated systems miss, a bet that looks worse each time model capabilities compound.
The study’s value isn’t the $4.6 million in simulated loot; it’s the proof that exploit discovery is now a search problem amenable to parallelized, low-cost automation.
EVM code is public, TVL data is on-chain, and agents can scan thousands of contracts in parallel at a cost lower than hiring a junior auditor for a week.
Builders who treat audits as one-time events rather than continuous adversarial engagement are operating on assumptions the data no longer supports.
Attackers are already running the simulations. Defenders need to run them first, and they need to run them on every commit, every upgrade, and every new vault before it touches mainnet.
The window between deployment and exploitation is closing faster than most teams realize.
The post Anthropic AI agents can now shatter smart contract security for just $1.22, exposing a terrifying economic reality appeared first on CryptoSlate.
The conventional wisdom says veteran holders don’t sell into weakness. They accumulate through drawdowns, harvest gains during euphoria, and otherwise sit still while newer cohorts churn.
Late 2025 is testing that model. Across Ethereum, XRP, and pockets of the DeFi stack, dormant whales are moving supply to exchanges as mid-term buyers flee, creating a bifurcated distribution pattern that reveals which assets have genuine cost-basis depth and which remain top-heavy with recent entrants.
Distribution without capitulation
What makes this moment distinct is not the fact of selling, as veterans always rotate, but the timing and composition.
Ethereum whales accumulated 460,000 ETH as the price slid below $3,200 in mid-November, yet Santiment’s Age Consumed metric slowed rather than spiked.
That divergence matters: if fewer very old coins are moving while aggregate whale balances rise, the pressure comes from holders in the three-to-ten-year band trimming positions rather than ICO-era wallets dumping.
Glassnode data shows those mid-duration cohorts selling roughly 45,000 ETH per day, a measured pace that contrasts with the panic-driven spikes seen earlier in the year when both short- and long-term holders exited simultaneously.
XRP tells the opposite story. Dormant Circulation for the 365-day cohort spiked to its highest level since July as whales transferred months-long holdings to Binance, reactivating supply that had been untouched through the prior rally.
CryptoQuant’s 100-day simple moving average for the Whale-to-Exchange Flow metric peaked on Nov. 6, signaling a multi-month uptrend and suggesting the distribution is structural rather than episodic.
When combined with dormant-supply reactivations across both one-year-plus and three-to-twelve-month bands, the pattern is clear: XRP’s 2025 moves systematically drew out older holders who had waited through consolidation and now see exits as the rational trade.
Although the flow of whale exchanges has subsided, it remains among the highest levels observed in 2025.

The trade-off embedded in these flows is straightforward. Ethereum’s whales are rotating, and older holders are selling into strength as new buyers enter at higher cost bases, building a rising realized cap floor even as the price consolidates.
XRP’s whales are distributing into a market where latecomers already hold most of the realized cap at elevated prices, leaving no absorption cushion if spot demand continues to fade.
Realized cap as the structural tell
Realized cap measures the aggregate cost basis of all coins, weighted by the price at which they last moved. For assets that built genuine cost-basis ladders over multiple cycles, realized cap acts as long-term support.
For assets that printed most of their realized cap in a single blow-off, the structure is brittle: when the top cohort sells, there’s little underneath.
Ethereum’s realized cap was $391 billion as of Nov. 18, according to Santiment, absorbing distribution from older holders via fresh inflows even as price chopped sideways.
That continued accumulation at varied entry points means the network retains cost-basis diversity, short-term holders sit more exposed if another leg down materializes, but veteran cohorts trimming at $3,200 don’t collapse the entire structure because new participants filled the gap at intermediate levels.
XRP’s realized cap nearly doubled from $30 billion to $64 billion during the late-2024 rally, with $30 billion of that coming from buyers who entered in the last six months.
By early 2025, coins younger than 6 months accounted for 62.8% of realized cap, up from 23%, concentrating cost basis at cycle highs. Glassnode’s realized profit-to-loss ratio has trended downward since January, indicating that recent entrants are now realizing losses rather than gains.
When whales send old coins to exchanges in November, reactivating dormant supply at precisely the moment latecomers turn underwater, the realized cap imbalance becomes the central vulnerability.
Dormancy as a leading indicator
Dormancy metrics track when previously idle supply reenters active circulation. Spikes in these indicators don’t automatically signal tops, but rather signal regime change.
When holders who weathered prior cycles decide conditions warrant an exit, their movement often precedes broader distribution because they operate on longer time horizons and larger position sizes than retail cohorts.
Ethereum’s Age Consumed spikes in September and October came from ICO-era wallets finally moving after years of inactivity, but those moves happened into strength rather than panic.
By mid-November, as whales holding 1,000 to 100,000 ETH accumulated over 1.6 million ETH, the Age Consumed metric quieted, meaning the heavy flows were driven by large holders rotating rather than ancient wallets capitulating.
That creates a floor: if the oldest cohorts aren’t selling and mid-term whales are buying, spot absorption can handle measured profit-taking from the three-to-ten-year band.
XRP’s dormancy pattern broke the other way. The 365-day Dormant Circulation hit levels unseen since July, with repeated red spikes as old coins woke up and moved to exchanges.
The reactivations became more frequent as the price struggled to hold above $2, suggesting that holders who sat through the consolidation decided the risk-reward no longer justified their patience.
When dormancy spikes coincide with weakening spot demand and a top-heavy realized cap, the signal is unambiguous: veterans are distributing into a market that can’t absorb it without breaking price support.
Who holds the bag
If Ethereum’s distribution continues at the current pace, three-to-ten-year holders selling 45,000 ETH daily while whales accumulate and realized cap rises, the outcome is a market with higher long-term support but increased short-term volatility.
New entrants at $3,000-$3,500 become the marginal sellers if price breaks lower, while veteran cohorts sit on unrealized gains large enough to weather another drawdown.
If XRP’s dormant-supply reactivations persist while the realized cap remains concentrated among holders with six-month-or-newer holdings, the path narrows.
Each wave of veteran distribution pushes recent buyers further underwater. Because those recent buyers account for the majority of realized cap, their capitulation would collapse the cost-basis floor rather than merely test it.
The risk is self-reinforcing: whales distribute, latecomers sell at losses, realized cap falls, and the next cohort of holders faces an even weaker support structure.
For protocols like Aave, where dormancy data remains sparse, a single address crystalizing $1.54 million in losses by selling 15,396 AAVE into a downtrend signals forced or fear-driven exits from recent entrants, not long-term holders harvesting gains.
When those losses happen while the asset trades below all major moving averages and broader DeFi risk appetite deteriorates, late-cycle capital is exiting rather than rotating.
Who decides the floor
The central question is whether this cycle’s dormant supply reactivations represent healthy rotation, veteran holders exiting at profits while new capital enters at higher bases, or the beginning of a broader deleveraging where top-heavy realized caps collapse under sustained distribution.
Ethereum’s data suggests that older coins are moving. Still, the bulk of recent flow comes from mid-term whales trimming rather than ancient wallets dumping, and rising realized cap confirms fresh money continues to average in.
XRP’s data suggests that dormancy spikes are drawing out one-year-plus holders, while 62.8% of realized cap sits with buyers who entered in the last six months.
The outcome depends on which cohort blinks first. If recent entrants hold and spot demand stabilizes, veteran distribution gets absorbed, and the market builds a higher floor through turnover.
If latecomers capitulate before veteran sellers exhaust themselves, realized cap falls, cost-basis depth evaporates, and the next support level sits far below the current price.
Whales are stirring. Whether that’s a rotation or a rout depends on who’s left to catch what they’re selling.
The post While Ethereum whales rotate, XRP data shows a fatal concentration flaw that leaves one group holding the bag. appeared first on CryptoSlate.
https://ambcrypto.com/feed/
 ENA builds momentum as whales accumulate and traders shift strongly toward longs.
 What fear is lurking beneath the surface of Trump-linked crypto stocks?
https://beincrypto.com/feed/
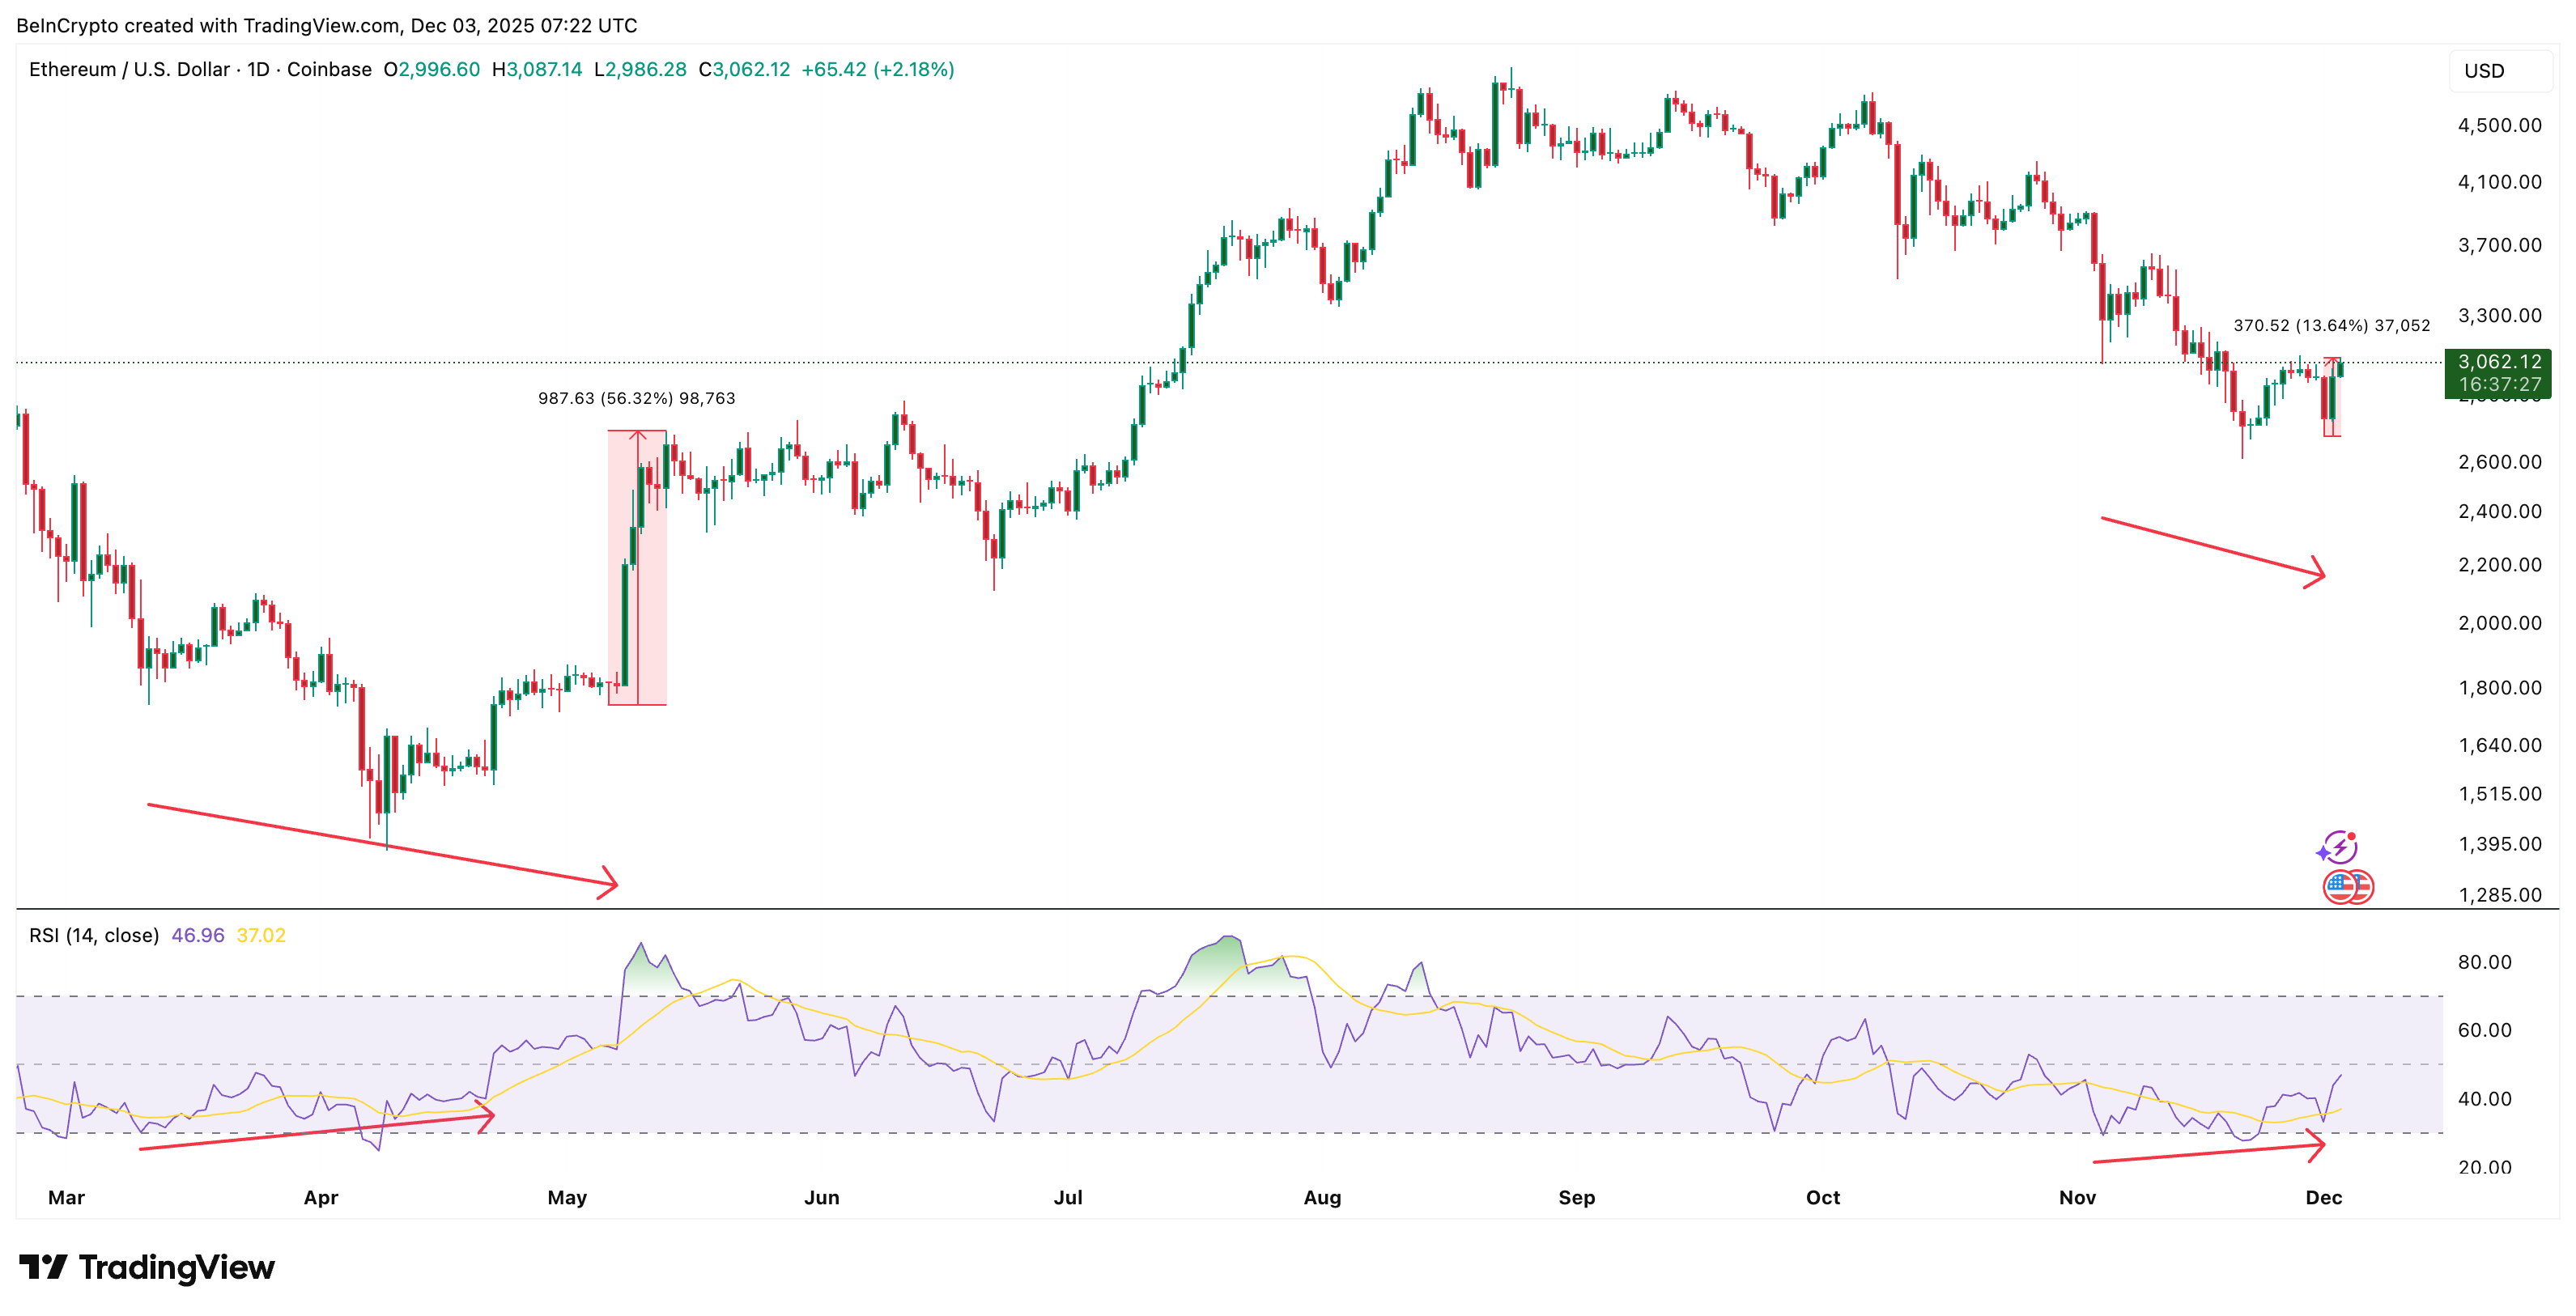
Ethereum price has climbed over 13% since December 1, helped by a broader market recovery and growing optimism ahead of today’s Fusaka upgrade, which improves how efficiently the network processes transactions. ETH is still down more than 17% over the past month, but the recent bounce and several technical signals look similar to what happened just before the Pectra upgrade in May 2025, when Ethereum rallied 56% in seven days.
The question now is simple: can Fusaka trigger that kind of move again?
Conditions Look Similar to Pectra — And Big Buyers Are Returning
During the Pectra phase (May 6–13), Ethereum surged 56% after flashing standard bullish divergence. That pattern occurs when price makes a lower low, but RSI (Relative Strength Index, a momentum meter from 0–100) makes a higher low. It often signals that sellers are losing control even as the chart still looks weak. More of a trend reversal.
P.S.: The Pectra upgrade dropped on May 7, 2025.
The same setup is forming now.
Between November 4 and December 1, ETH made a lower low, but RSI formed a higher low. That mirrors the exact structure that appeared before the Pectra move.
Want more token insights like this? Sign up for Editor Harsh Notariya’s Daily Crypto Newsletter here.
Large holders also show early accumulation.
The number of Ethereum addresses holding at least $1 million has risen from 13,322 to 13,945, a 4.68% increase. Since each wallet holds a minimum of $1 million, this reflects at least $623 million in added capital entering the network’s top tier of holders. Big buyers entering ahead of a major technical upgrade is historically a constructive sign.
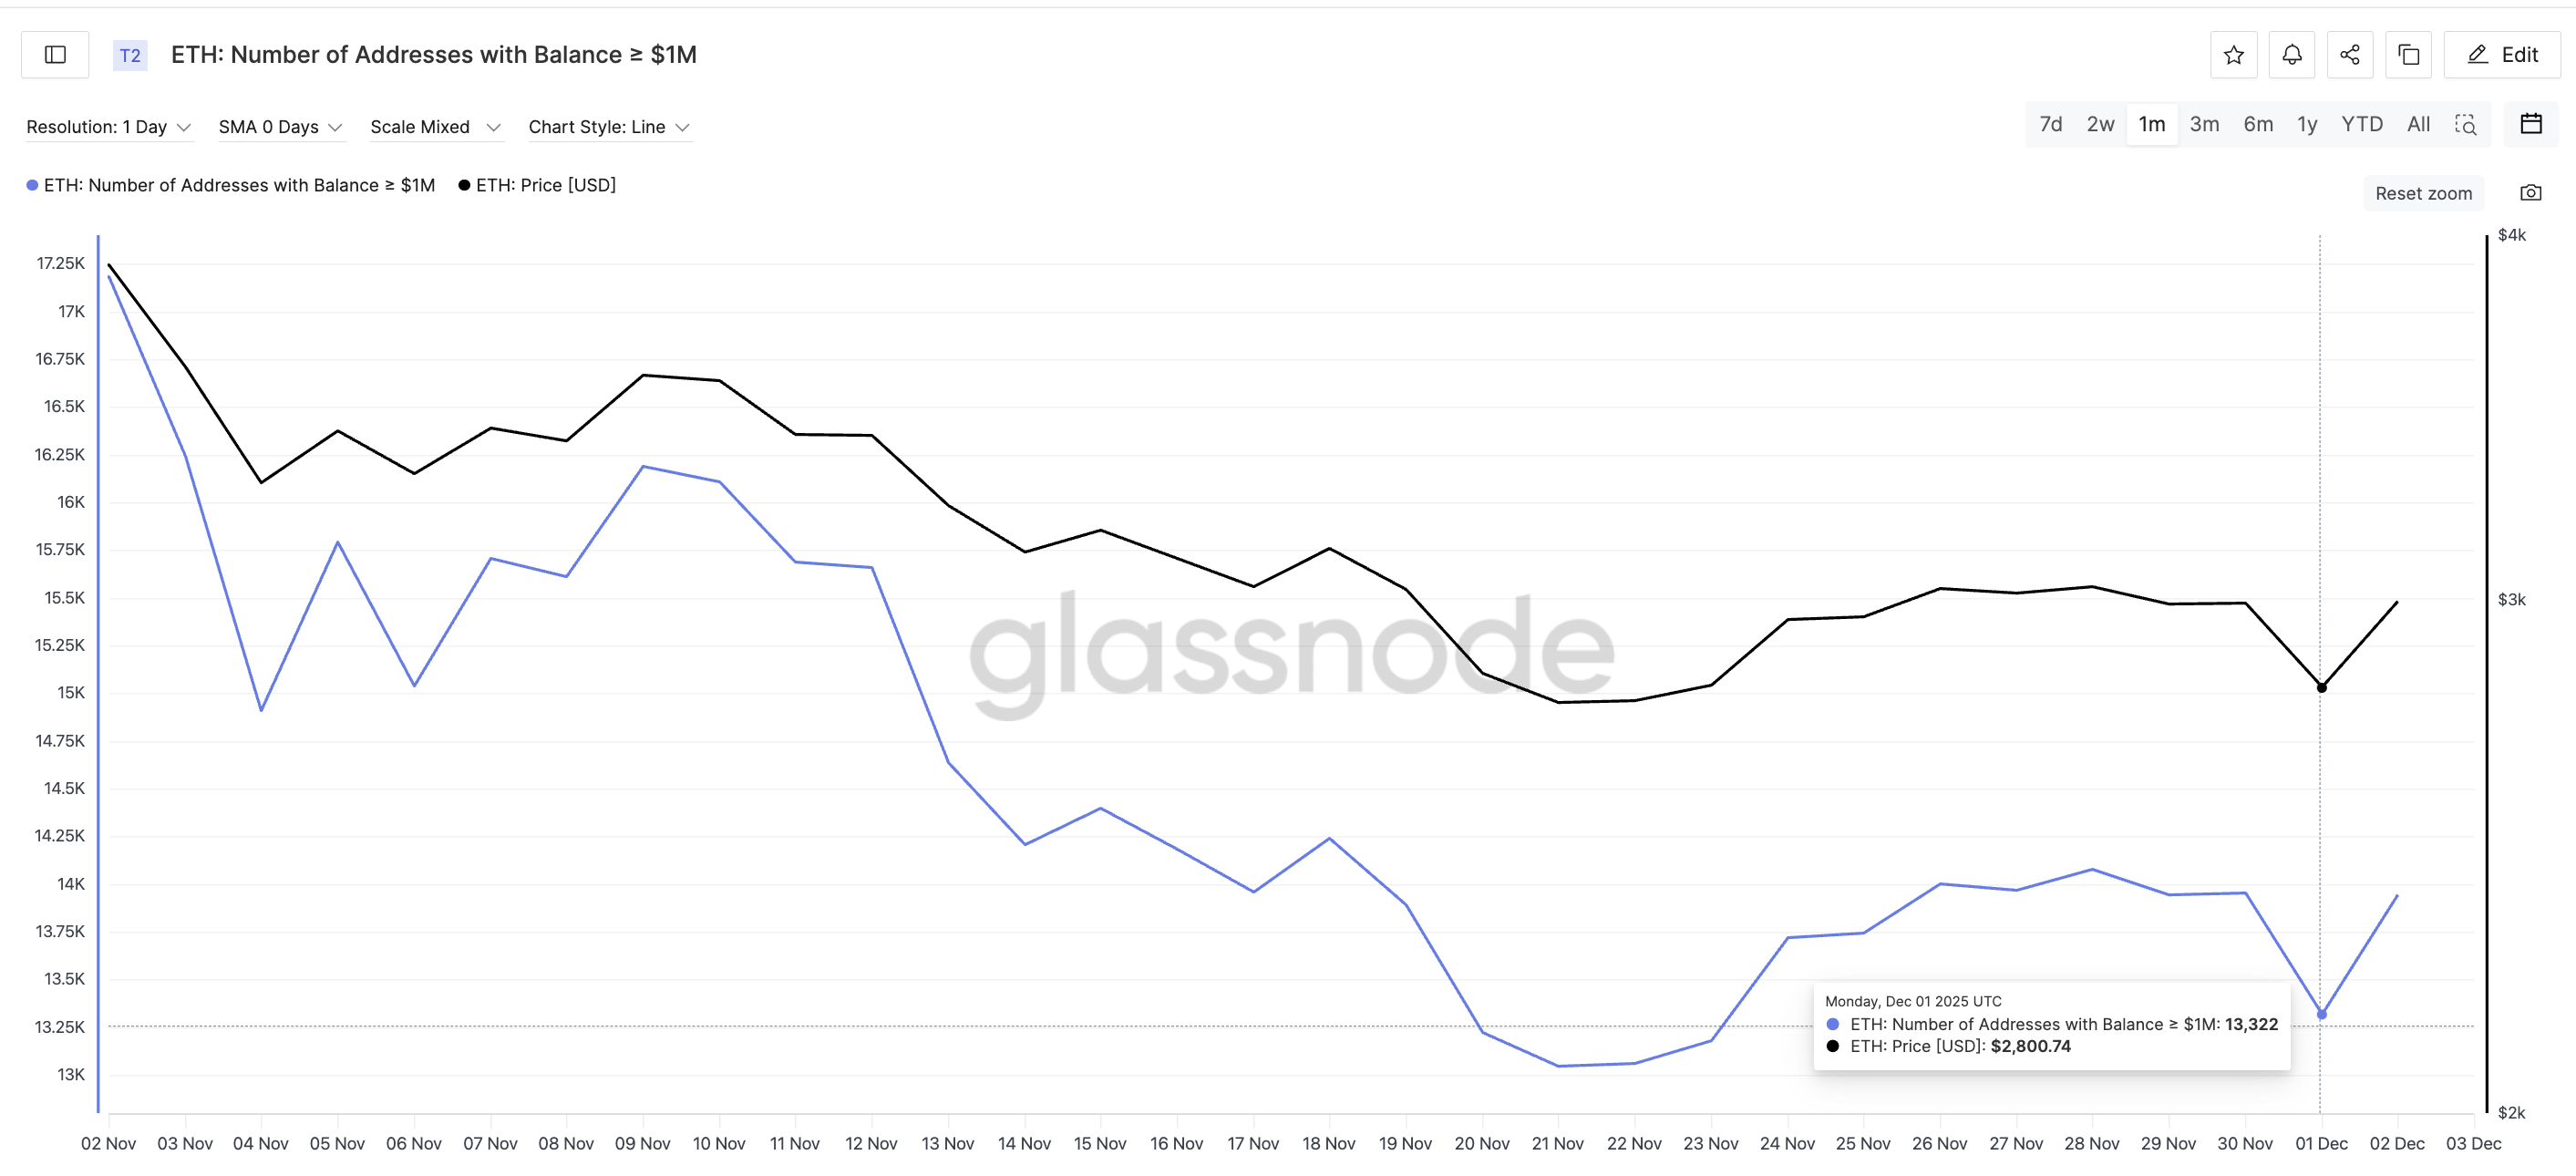
Together, the divergence pattern and fresh large-wallet inflows build a case that Fusaka could act as a catalyst — if the key breakout level is cleared.
One Cost-Basis Cluster and One Ethereum Price Level Decide Everything
Whether ETH shows a Pectra-style extension depends on clearing a single supply wall. Glassnode’s Cost Basis Distribution reveals the heaviest near-term supply cluster between $3,154 and $3,179, where about 2.76 million ETH sits. This aligns almost perfectly with the chart’s resistance at $3,166 (a strong resistance and support line).
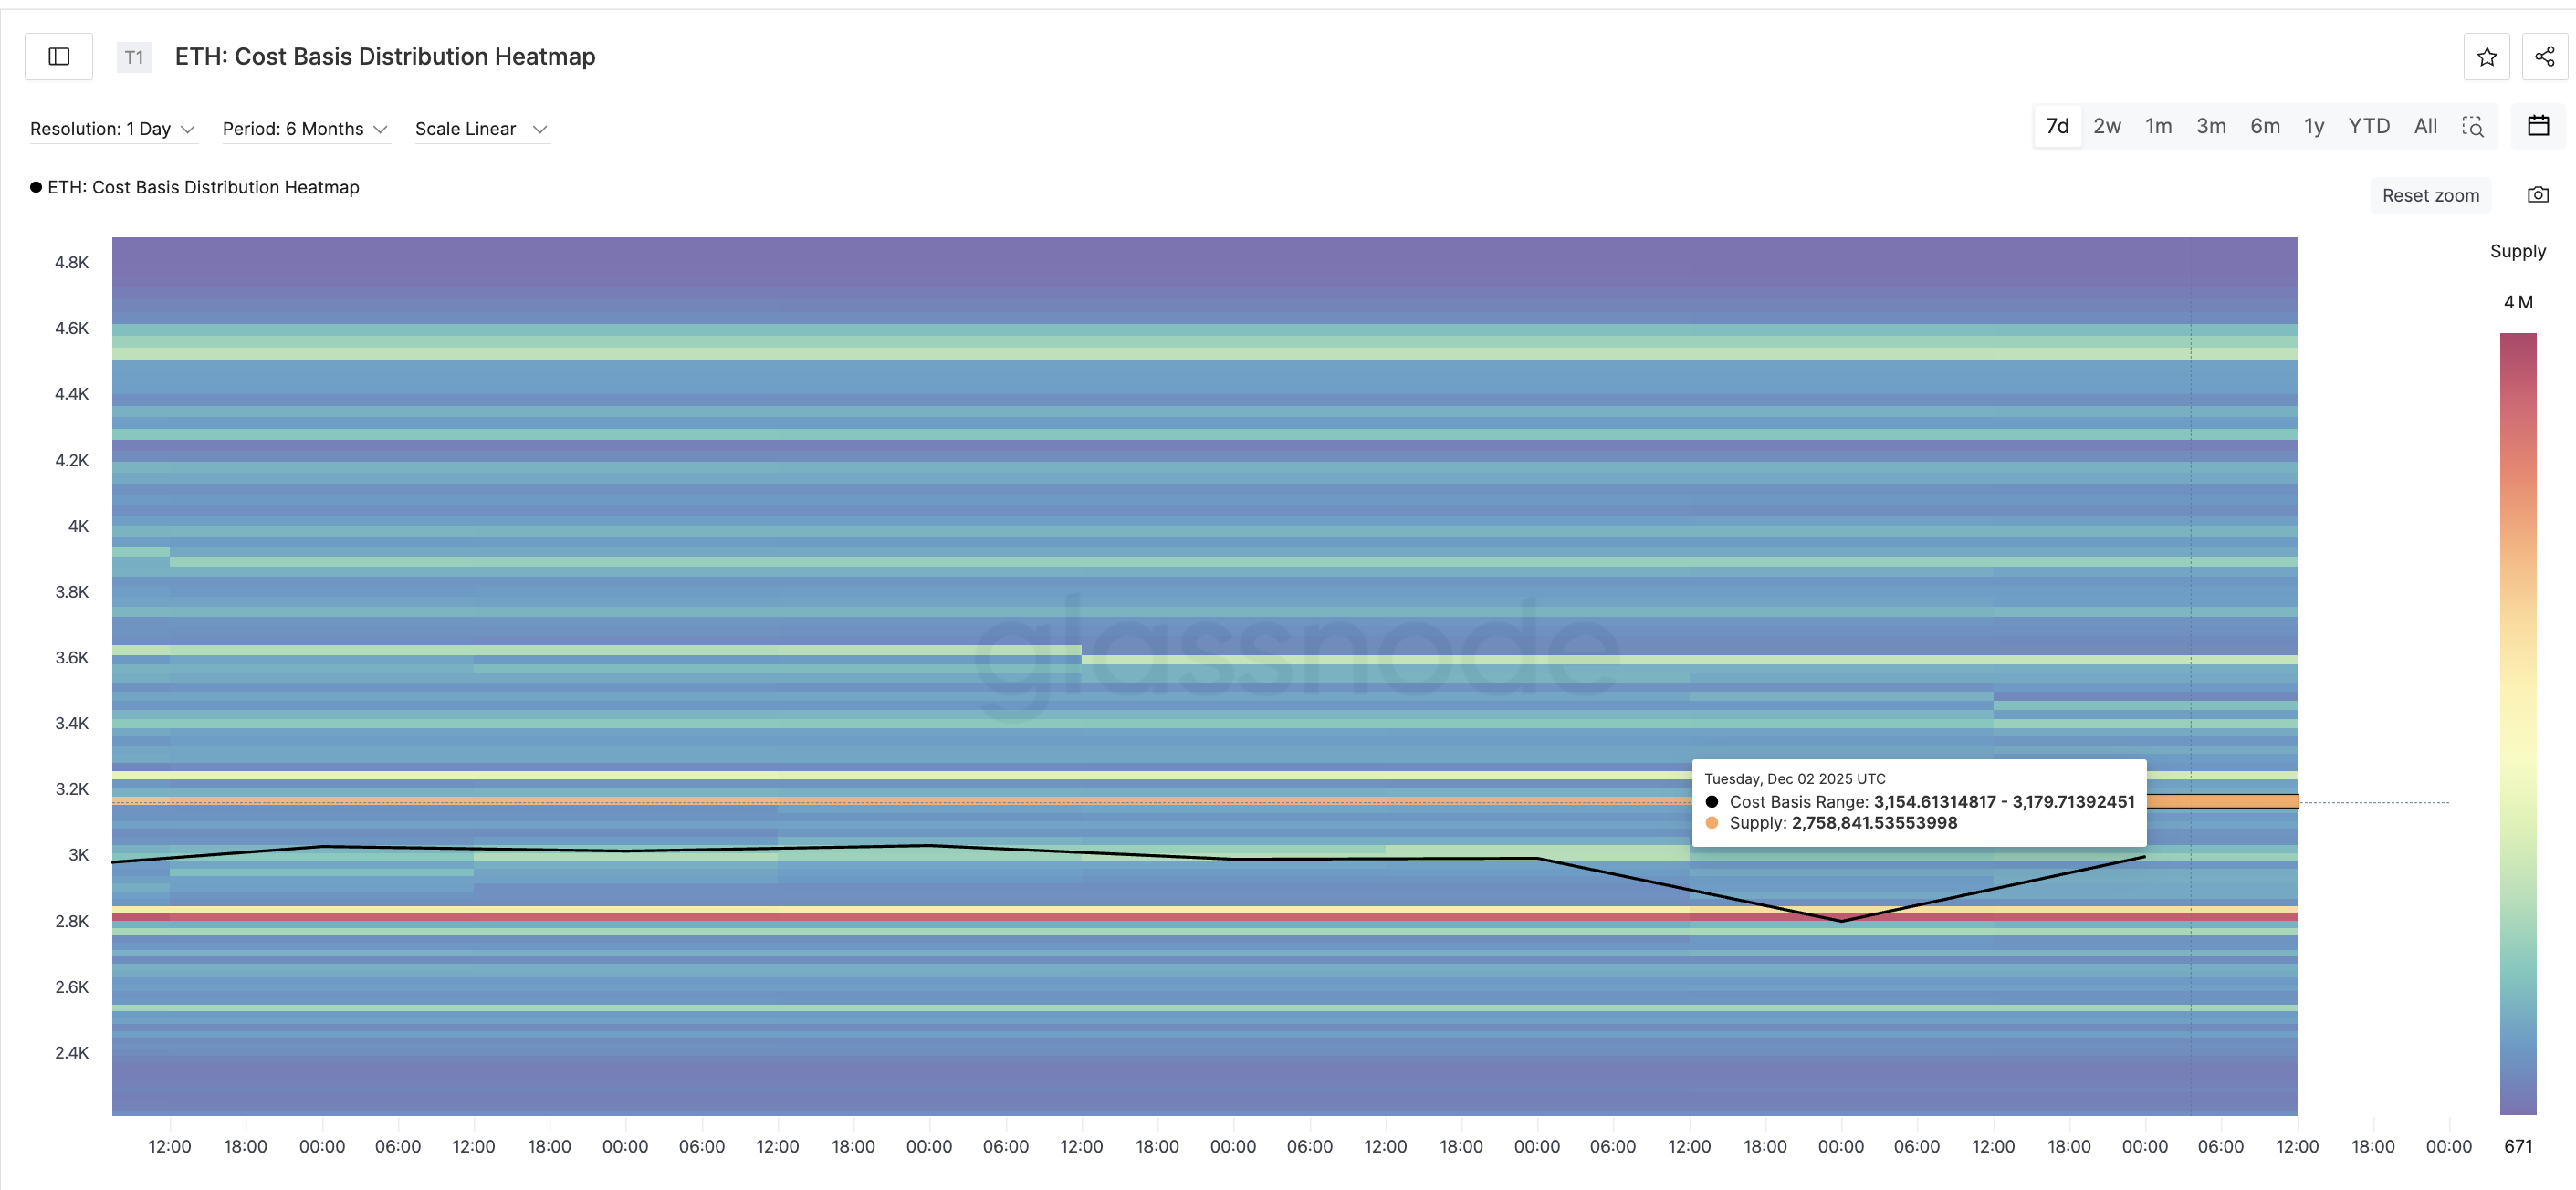
A clean daily Ethereum price candle above $3,166 would:
• show buyers have almost absorbed the largest supply zone
• open room for a push toward $3,653
If momentum mirrors the Pectra structure, a 56% extension from December’s lows would target roughly $4,262, which also matches a strong historical ceiling.
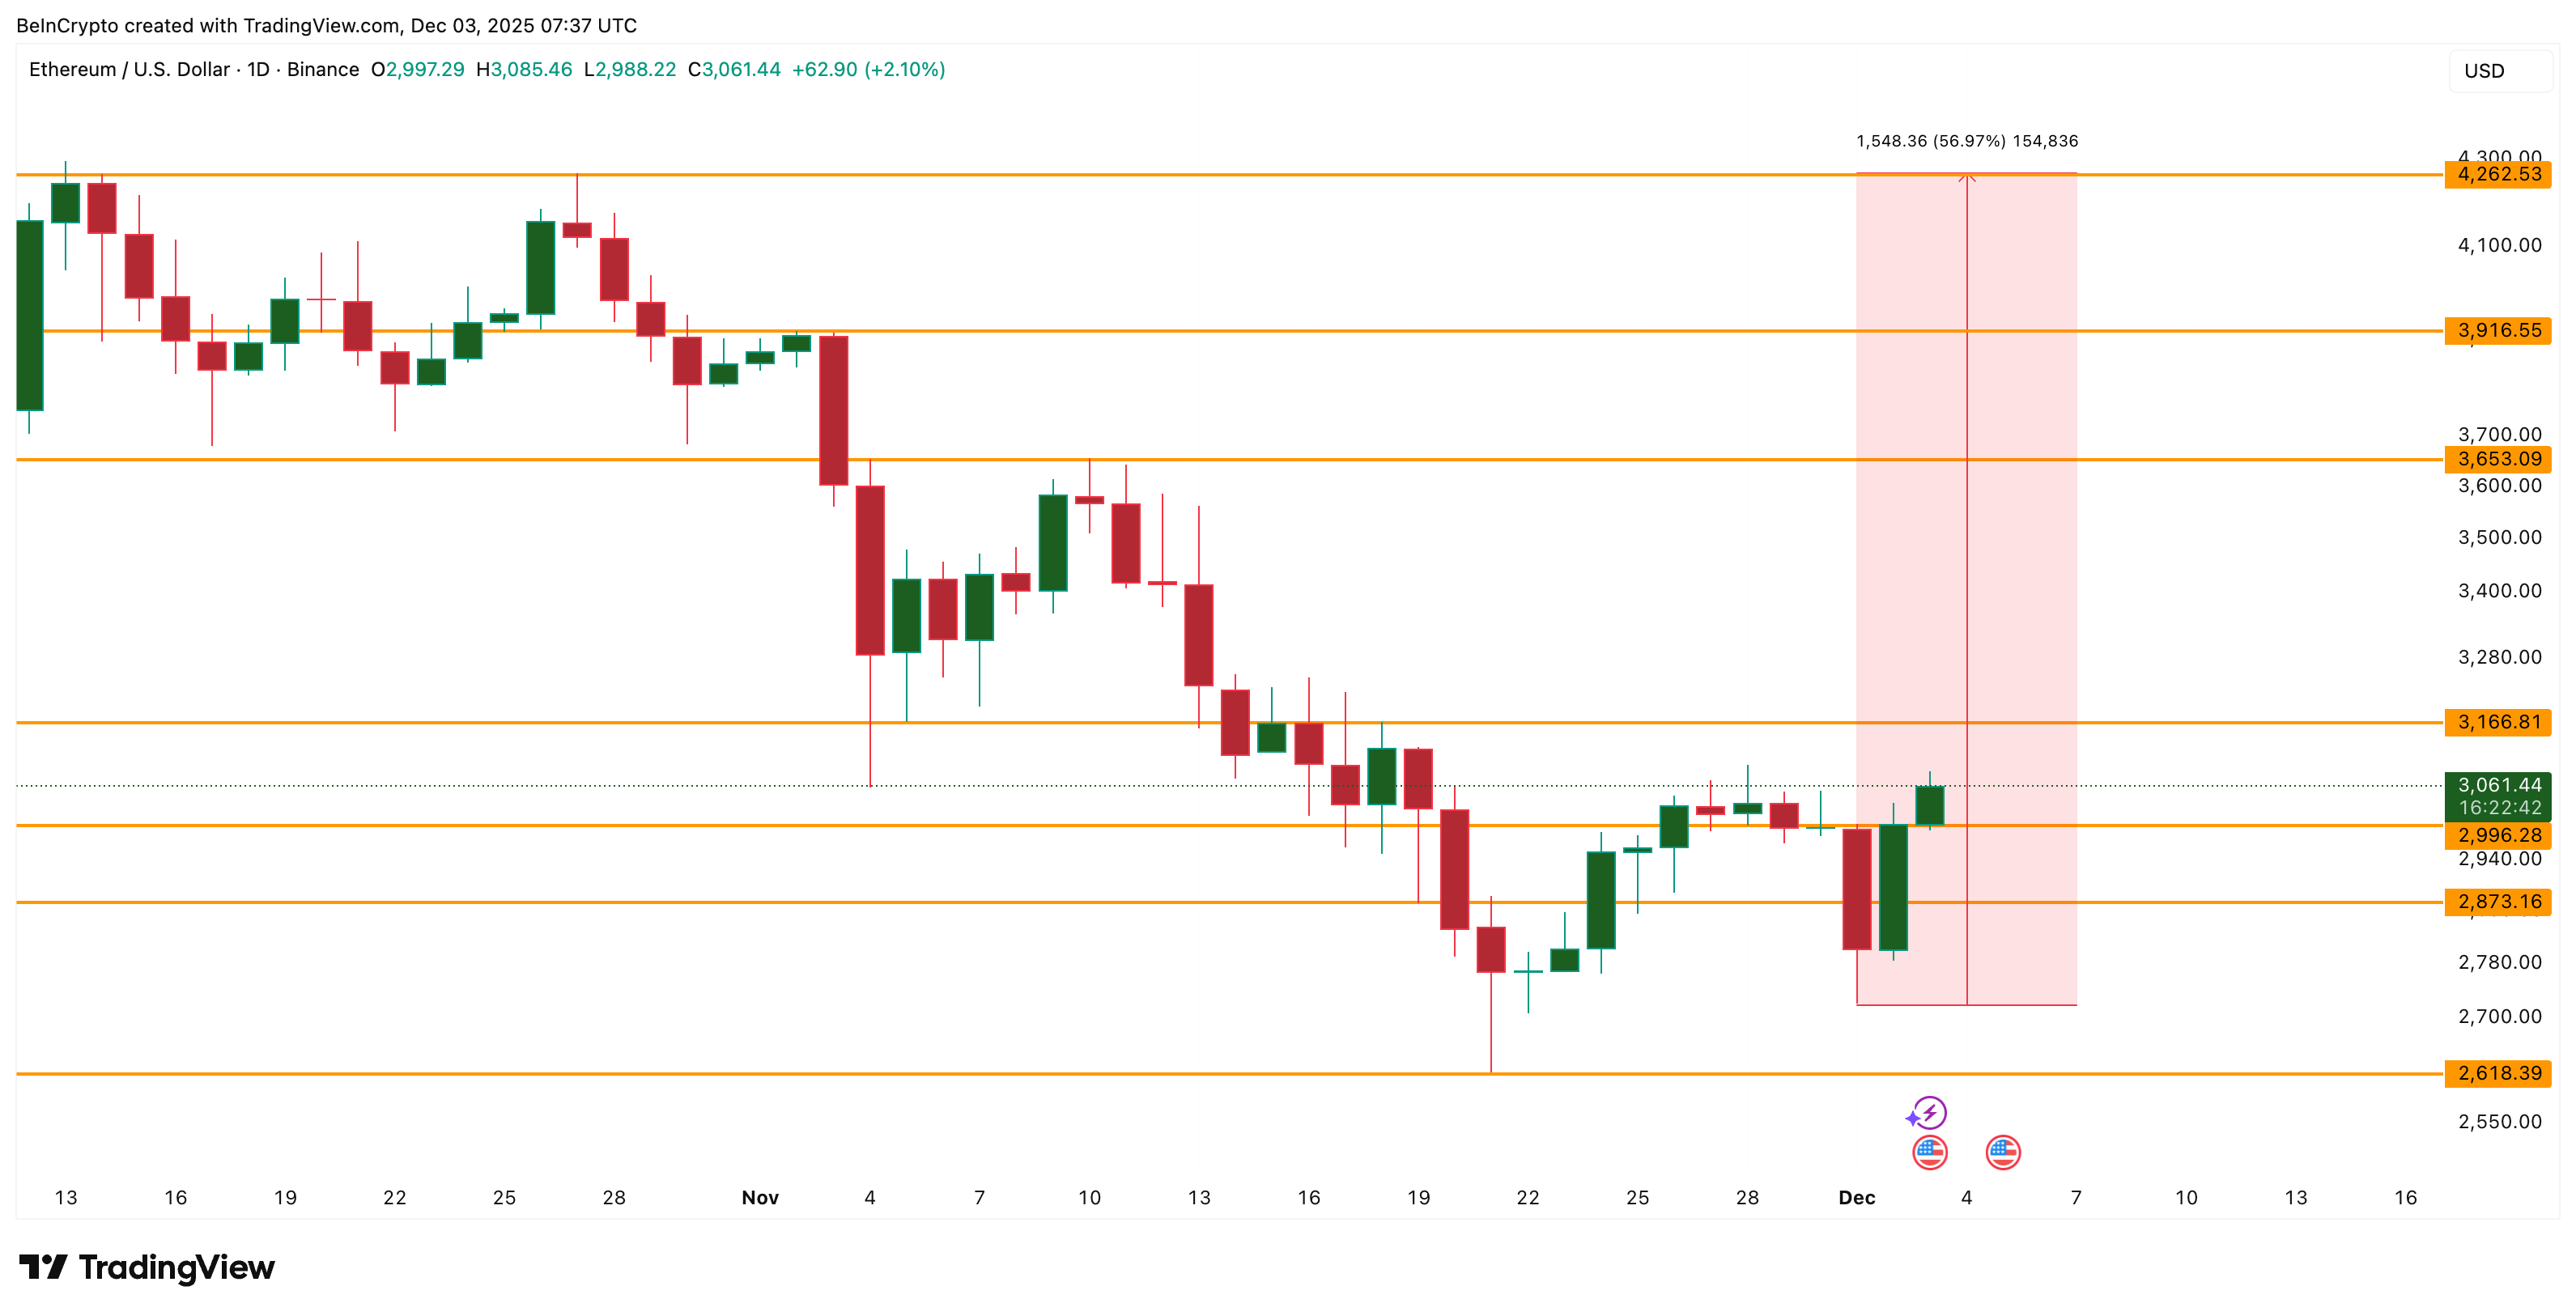
On the downside, ETH’s structure weakens below $2,996. Losing that range exposes $2,873, and if selling pressure expands, $2,618 becomes the deeper support to watch for the Ethereum price.
The post Could the Fusaka Upgrade Light the Fuse for a Pectra-Like 56% Ethereum Price Rally? appeared first on BeInCrypto.
Welcome to the US Crypto News Morning Briefing—your essential rundown of the most important developments in crypto for the day ahead.
Grab a coffee to read how the Bitcoin mining sector is changing. Skyrocketing costs, collapsing fees, and the rise of AI are forcing miners to rethink their playbook, turning once-stable operations into a battleground for next-generation compute power.
Crypto News of the Day: AI Takes Over Bitcoin Mining Racks as Costs Explode and Profitability Craters
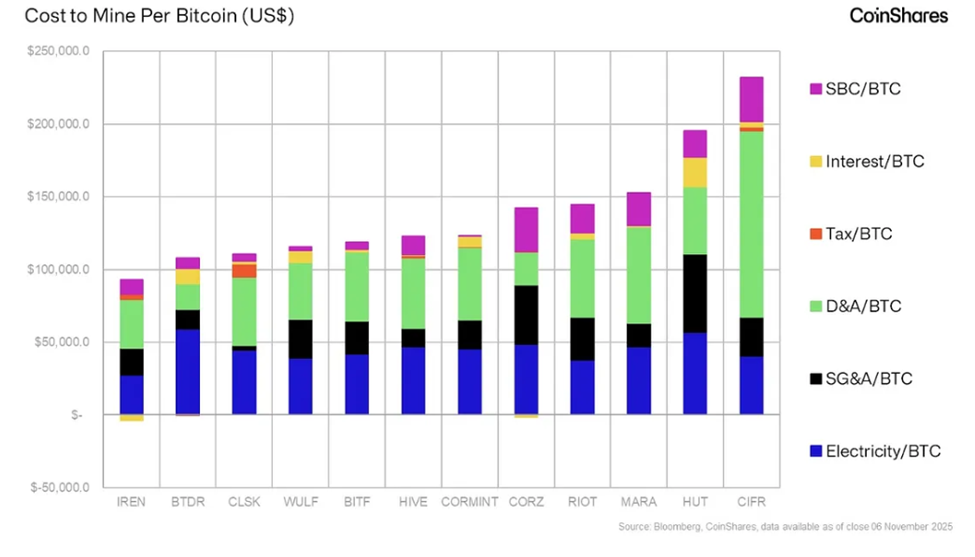
The CoinShares Bitcoin Mining Report Q4 2025 reported that the sector has hit its breaking point. Production costs have surged to all-time highs, hash price has collapsed, and artificial intelligence (AI) is now outbidding miners for their own infrastructure, triggering the most dramatic structural shift the sector has ever faced.
The industry entered Q2 2025 with a brutal new reality:
- The average cash cost to mine one BTC among public miners jumped to approximately $74,600,
- All-in costs soared to $137,800.
- Transaction fees, once a buffer for miner revenue, fell below 1% of block rewards in May and June, the weakest contribution since the 2024 halving.
Yet even as margins collapsed, the Bitcoin network continued to climb, smashing through 1 Zetta hash/s for the first time in August.
Public miners contributed only about 80 EH/s of year-to-date growth, meaning most of the expansion is now coming from private operators, sovereign miners, and well-capitalized energy players with vastly cheaper power.
The result: miners are being diluted by hashrate growth they are no longer driving.
AI Moves In — And It Pays 10–20× More Per Megawatt
A far bigger disruption is unfolding at the infrastructure level. Industrial-scale mining campuses, comprising 100MW to 1GW sites, share nearly identical power, cooling, and rack density requirements with modern AI datacenters.
That overlap has turned mining facilities into prime targets for hyperscalers.
Deals from Google–TeraWulf, Google–Cipher, and multi-site agreements with Fluidstack signal the same direction, that big-tech is moving into miner-built capacity at a premium.
The math explains why. Bitcoin mining yields roughly $1 million per megawatt, while AI compute generates $10 million to $20 million per megawatt.
No miner can ignore that spread.
Industry Splits: AI Megacampuses vs. Mobile, Ultra-Low-Cost Miners
The sector is now diverging into two clear models:
- 1. Megascale miners → fully or partially converting to AI/HPC
These facilities can upgrade their electrical topology and uptime standards to meet enterprise requirements. They’re signing decade-long contracts and shifting from volatile block rewards to stable, capacity-based revenue.
2. Low-cost, mobile miners → shifting to stranded energy
Miners unable to compete with AI are moving off-grid: flare gas, remote hydro, and surplus renewables. Portable rigs are being deployed everywhere cheap energy exists, echoing mining’s early decentralized roots.
This migration marks a long-term reshaping of the industry, and not a temporary cycle.
According to a CoinShares report:
- Hashprice averaged approximately $50 per PH/s/day throughout Q2, continuing its post-halving slide.
- With difficulty rising, fees stagnant, and Bitcoin trading mostly sideways, older ASIC fleets have been forced offline.
Analysts expect hashprice to remain range-bound between $37–55 per PH/s/day through 2028 unless BTC rallies far faster than hashrate growth.
A Structural Shift: AI Outbids Bitcoin
For the first time in Bitcoin’s history, miners are being priced out of their own infrastructure.
AI’s superior economics, hyperscaler deal flow, and the rising cost of industrial mining are pushing the industry into a permanent transformation.
The Bitcoin network remains strong, where hashrate is still climbing, but the business of mining is being rewritten fast.
This puts miners at an impasse, to either go big into AI, or go remote into stranded power.
Chart of the Day
Byte-Sized Alpha
Here’s a summary of more US crypto news to follow today:
- Yi He appointed Binance co-CEO amidst legal and regulatory challenges.
- Kevin Hassett as Trump’s Fed pick: How will his policy impact crypto in 2026?
- Ethereum Fusaka goes live today: Can it trigger a Pectra-like rally?
- Is Bitcoin ready to end its 5-week downtrend or face rejection at $95,000?
- Vanguard ‘degen effect’ fuels 10% surge for Bitcoin in explosive rebound.
- PENGU token jumps 30% on NHL Deal, but $108 million sell-off sparks fear.
- Binance marks 3 altcoins for delisting: Everything you need to know.
- V-shape bounce, rare Bitcoin signal, $13 billion Fed shock: What’s coming?
Crypto Equities Pre-Market Overview
| Company | At the Close of December 2 | Pre-Market Overview |
| Strategy (MSTR) | $181.33 | $185.83 (+2.48%) |
| Coinbase (COIN) | $263.26 | $269.39 (+2.33%) |
| Galaxy Digital Holdings (GLXY) | $25.36 | $25.90 (+2.13%) |
| MARA Holdings (MARA) | $11.91 | $12.27 (+3.02%) |
| Riot Platforms (RIOT) | $15.22 | $15.55 (+2.17%) |
| Core Scientific (CORZ) | $15.82 | $16.03 (+1.33%) |
The post Bitcoin Mining Hit Its Breaking Point — Now AI Is Taking Over Its Racks | US Crypto News appeared first on BeInCrypto.
https://cryptonewsz.com/feed/
https://www.newsbtc.com/feed/
Sui (SUI) is drawing renewed market attention after staging one of its strongest breakouts in months, rising sharply at a time when most large-cap altcoins remain range-bound.
The latest 31% surge was triggered by a series of developments that converged within days, most notably Coinbase’s approval to offer SUI trading to New York residents, a move that places the token inside one of the most heavily regulated crypto markets in the U.S.
The rally also arrived immediately after one of the largest token unlocks of the month, an event that would normally dampen prices but instead saw buyers step in with force.

New York Listing Boosts Liquidity and Institutional Demand
SUI surged between 25% and 32% over the past 24 hours after Coinbase confirmed that New York residents can now buy and trade the token across its web and mobile platforms.
The approval extends SUI’s reach into one of the most tightly regulated U.S. markets, strengthening its profile as a compliant layer-1 network and increasing accessibility for institutional investors.
The listing comes at a notable time. On December 1, SUI unlocked approximately $82–86 million worth of tokens, increasing circulating supply by more than 0.5%. Large unlocks typically pressure prices, but SUI moved higher instead, signaling strong demand absorption.
Trading volume has more than doubled, hitting roughly $1.5 billion, levels analysts say indicate genuine accumulation rather than short-lived speculation.
The launch of USDsui, a fiat-backed stablecoin designed for payments and DeFi use across the Sui ecosystem, also contributed to renewed interest. Combined with Coinbase’s expansion, these developments have strengthened confidence in Sui’s broader market positioning.
SUI Technical Indicators Point to Momentum Shift
Price action shows that SUI recently rebounded from November’s lows near $1.12, climbing above the $1.60 support zone.
Indicators such as RSI and MACD now suggest easing selling pressure and a potential shift in short-term momentum. Analysts note that breaking above the mid-Bollinger Band near $1.90 would confirm a broader trend reversal.
SUI has also moved above the Keltner mid-band for the first time in weeks, with volume delta readings showing strong spot-market buying.
The next major resistance sits between $1.80 and $1.95, followed by a wider zone extending to $2.30. A decisive close above $1.92 is viewed as critical for invalidating November’s downtrend.
Rally Depends on Volume HoldingMarket watchers say the current rally hinges on sustained demand. If daily volume remains above $1.5 billion and price holds the $1.60–$1.67 support zone, institutional participation could continue to push the token higher toward the $1.90 level.
However, weakening volume or a drop below $1.48 may signal that SUI has formed a local top. For now, sentiment remains constructive as the token benefits from increased U.S. accessibility, improving technical signals, and expanding ecosystem activity.
Cover image from ChatGPT, SUIUSD chart from Tradingview
Ethereum has reclaimed the $3,000 level after a strong market reaction to improving macro conditions, offering investors a much-needed shift in momentum. The move comes just days after the Federal Reserve officially ended Quantitative Tightening (QT), a policy shift that immediately boosted liquidity expectations across all risk assets. With markets now pricing in an imminent interest rate cut, confidence has begun to return, and ETH is one of the first major assets to respond.
This rebound reflects more than just macro relief. According to data from Arkham, shared by Lookonchain, Bitmine continues to accumulate Ethereum at current prices, reinforcing bullish sentiment at a moment when many traders remain cautious. Bitmine’s persistent buying throughout the correction has become one of the most influential signals for on-chain analysts, suggesting that large players see long-term value even as the market wrestles with volatility.
Reclaiming $3,000 places Ethereum back above a key psychological level, and the combination of supportive macro policy and whale accumulation provides a stronger foundation than the market had just weeks ago.
Bitmine and Linked Wallets Expand Ethereum Holdings
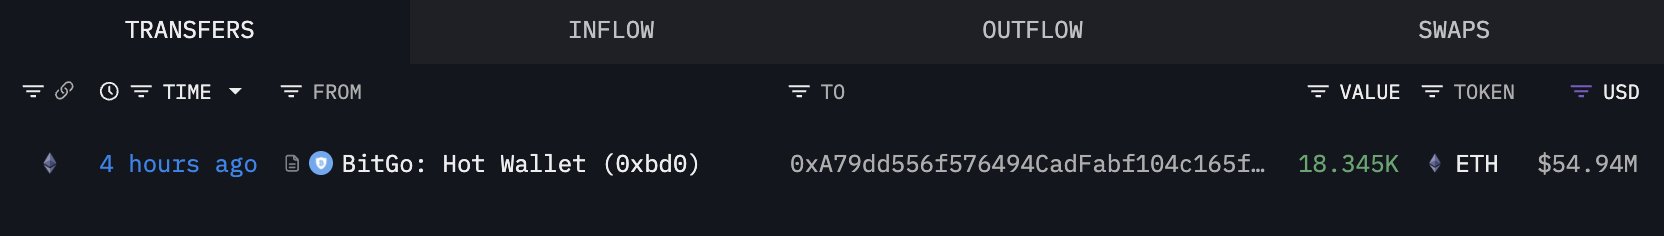
According to data from Arkham reported by Lookonchain, Bitmine has purchased another 18,345 ETH, worth approximately $54.94 million, just a few hours ago. This marks yet another large buy in a growing series of aggressive accumulation moves that Bitmine has made throughout the correction. Their continued willingness to buy at current levels signals strong confidence in Ethereum’s long-term value, even as the market navigates heightened volatility.
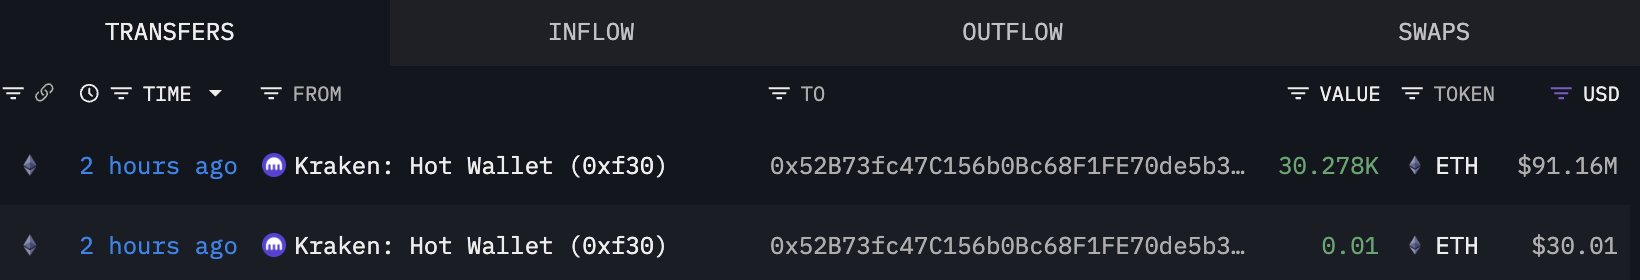
Shortly after this report, Lookonchain highlighted activity from a newly created wallet, 0x52B7, which withdrew 30,278 ETH—valued at $91.16 million—from Kraken. The size and timing of the withdrawal have led analysts to speculate that this wallet may be linked to Bitmine or part of a broader accumulation strategy.
Large withdrawals from exchanges typically indicate that the owner intends to hold the assets off-exchange, often for long-term storage or staking, rather than preparing to sell.
If the wallet is indeed connected to Bitmine, this would bring their latest combined accumulation to nearly 50,000 ETH in a single day. Such behavior suggests strategic positioning ahead of potential macro-driven upside or internal confidence in Ethereum’s recovery.
This kind of synchronized whale activity often precedes significant price shifts, reinforcing the idea that large players are preparing for a stronger market phase.
ETH Reclaims $3,000 But Still Faces Key Resistance
Ethereum’s 3-day chart shows a notable improvement after reclaiming the $3,000 level, but the broader trend still carries signs of fragility. The recent bounce followed a deep corrective move that sent ETH from the $4,500 region down to the $2,700–$2,800 support zone, where buyers finally stepped in with conviction. The strong lower wicks around this area confirm that demand remains active, but Ethereum has yet to fully recover its bullish structure.

Price now trades just below the 50 SMA, which sits near the $3,100–$3,150 zone—an important short-term resistance level. A clean break above this moving average would signal renewed momentum and increase the chances of retesting the $3,400–$3,600 range. Meanwhile, the 100 SMA and 200 SMA remain slightly above price, reflecting the broader downtrend that has dominated since September.
Volume has picked up slightly during the recovery, but it remains muted compared to the selling spikes seen during the drawdown. This indicates cautious buying rather than aggressive accumulation at these levels. To confirm a trend reversal, ETH must close above the 50 SMA and then challenge the cluster of resistance around $3,200–$3,300.
Featured image from ChatGPT, chart from TradingView.com


