Financial RSS Feeds
https://www.investing.com/rss/news.rss
https://cointelegraph.com/rss

The aggressive buying by this particular cohort of Bitcoin holders signals a potential “long-term bullish divergence," according to crypto sentiment platform Santiment.

Crypto markets sell off as US stocks and global markets react to President Trump’s new tariff threats. Will the tensions put a stop to Bitcoin's start-of-year recovery?
https://www.coindesk.com/arc/outboundfeeds/rss/
https://cryptobriefing.com/feed/
The institutionalization of crypto by 2026 could revolutionize financial systems, enhancing liquidity, efficiency, and global settlement.
The post Ripple President Monica Long predicts half of Fortune 500 will adopt crypto strategies this year appeared first on Crypto Briefing.
This partnership signifies a shift in retirement planning, integrating cryptocurrency exposure into traditional financial products, potentially broadening market appeal.
The post BlackRock partners with Delaware Life to bring Bitcoin into fixed index annuities appeared first on Crypto Briefing.
https://bitcoinist.com/feed/
Trader Cryptollica (@Cryptollica) is arguing that an old relative-value signal is “back” in crypto markets, pointing to the DOGE/NVIDIA ratio and an unusually depressed Dogecoin RSI reading as evidence that capital could rotate from AI-linked equities into high-beta meme coins.
Dogecoin Vs. Nvidia: Rotation Incoming?
In a post on X, Cryptollica said the DOGE/NVIDIA chart has returned to a long-term support zone that previously preceded outsized Dogecoin outperformance versus Nvidia in prior cycles. “THE SIGNAL IS BACK. IT’S HAPPENING AGAIN (2017… 2021… NOW),” the trader wrote.
“The last two times this specific signal flashed on the DOGE/NVIDIA chart, we saw the biggest wealth transfer in history. The crowd is chasing the AI top. The algorithm is loading the Meme bottom. (Altcoin bottom).”
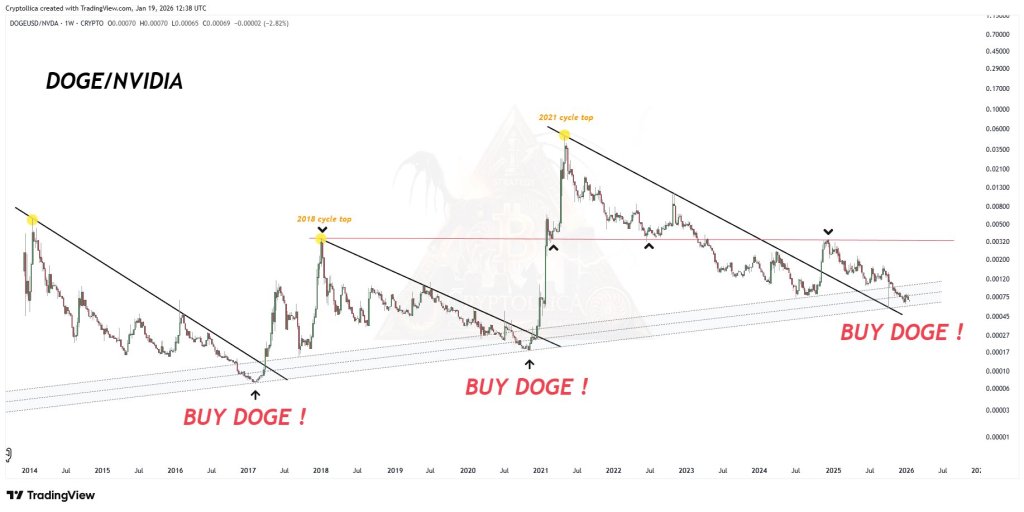
The core claim is less about Dogecoin in isolation and more about positioning on a ratio between what Cryptollica framed as two cultural extremes: “You are watching the wrong chart. This is the ratio of ‘The World’s Most Valuable Company’ (AI) vs. ‘The World’s Most Famous Meme’.” From that framing, the trader leans into a cycle-rhymes narrative, asserting that the ratio has repeatedly found channel support before a DOGE-led surge.
“Structure is repeating history,” Cryptollica wrote, attaching specific historical comparisons. “2017: Ratio hit channel support – DOGE outperformed NVDA by 100x. 2021: Ratio hit channel support – DOGE outperformed NVDA by 50x. NOW: We are back at the exact same support line.”
The posts also attach a broader liquidity-rotation story that has circulated in various forms across risk markets: when one trade stops working, capital seeks the next high-beta outlet: “When the AI Bubble exhales, that liquidity doesn’t vanish. It rotates into High-Beta Speculation,” the trader wrote. “The crowd is buying NVDA at the top. The algorithm is positioning for the DOGE reversal.”
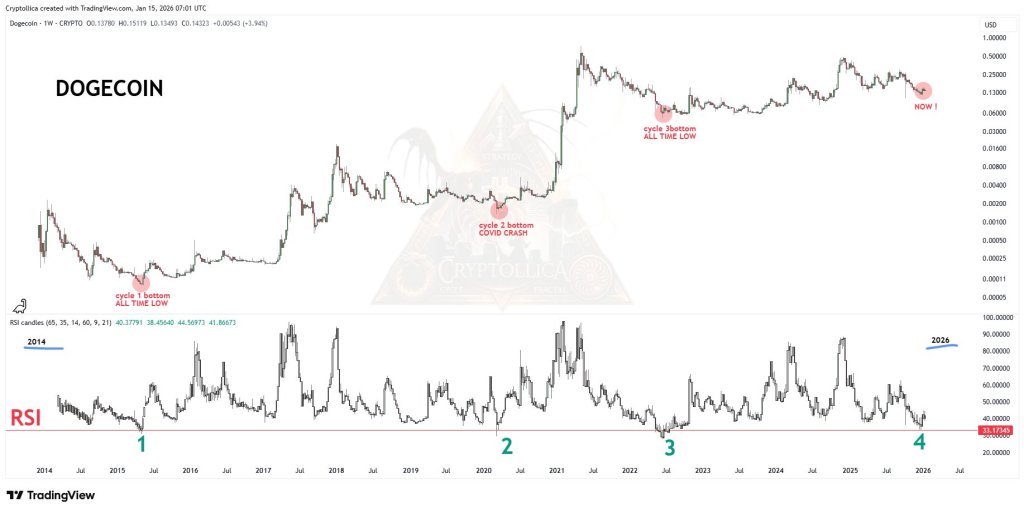
Is Dogecoin An ‘Epic Buying Opportunity’?
In another post, Cryptollica shifted from the ratio to Dogecoin’s weekly momentum indicator, sharing a second chart highlighting RSI levels and labeling prior cycle lows. “Here you are witnessing an opportunity that only comes around once every 12 years,” the trader wrote. “Over the past 12 years (2014–2026), Dogecoin’s RSI has dropped this low only 4 times. Every single one was an epic buying opportunity.”
The post describes those four moments as a sequence of cycle bottoms, including an “all-time low” first cycle bottom, a “cycle bottom + COVID crash,” a “last cycle bottom,” and “RIGHT NOW!” Cryptollica concluded with a blunt decision frame: “Math or emotions — which one decides for you?”
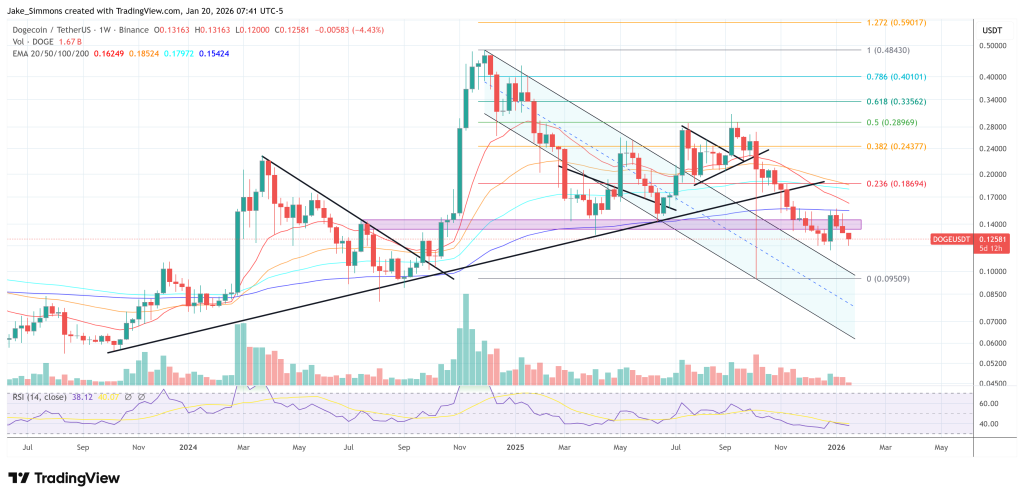
While neither post includes an explicit price target, the analyst said in early December that he expects Dogecoin to reach $1.30 over the medium term, citing a parallel channel top on the 3-day DOGE/USD chart.
At press time, DOGE traded at $0.12581.
Bitcoin is trying to hold above the $91,000 level as the market searches for support, but demand remains fragile after weeks of volatility. While the recent decline has pressured sentiment, a CryptoQuant report suggests January is still shaping up as a recovery phase rather than a full breakdown. The analysis points to cautious optimism driven by institutional and whale-level accumulation, while retail participation remains hesitant and risk-averse.
According to Binance-related data, Bitcoin’s spot price action and funding rates have started to diverge in early 2026, signaling a spot-driven market environment. This setup is often viewed as constructive because it implies the latest move is being supported more by real spot buying than by excessive leverage in derivatives. In practice, a spot-led trend tends to reduce the risk of sudden liquidation cascades, which have recently amplified downside moves across the crypto market.

CryptoQuant notes that spot-driven conditions can also create more durable rallies, since they attract organic inflows and allow price to climb without relying on unstable speculative positioning. Historical comparisons to the 2021 and 2024 cycles show similar divergences between spot strength and muted funding rates often preceded extended upside expansions, ranging from 20% to 50%.
Is the Four-Year Bitcoin Cycle Breaking Down?
The CryptoQuant report raises a bigger question that many investors are now debating: is the traditional four-year Bitcoin cycle starting to fade? As the market matures, analysts argue that the old post-halving pattern may no longer apply in the same way. Since 2024, spot Bitcoin ETFs and corporate treasuries have been absorbing a growing share of supply, potentially creating steadier demand and reducing the boom-and-bust dynamics that defined prior cycles.
This argument gained traction in 2025. Despite being a post-halving year, Bitcoin failed to deliver the type of parabolic rally seen in previous cycles, while altcoins also struggled to produce a true “altseason.” That divergence has led some analysts to conclude that halvings are becoming less dominant as a driver, especially now that Bitcoin trades as a $2T+ macro asset.
Instead, market direction may be increasingly shaped by global liquidity conditions, including Federal Reserve policy, M2 growth, geopolitical risk, and large-scale institutional flows. Analysts like Raoul Pal have framed this as a shift toward longer liquidity cycles that could last five years or more, reinforcing the idea that the four-year framework may be outdated.
The report also highlights Binance as a critical reference point. Historically favored by whales, Binance remains a major leading indicator for broader crypto market positioning and flows.
Bitcoin Weekly Chart Signals Fragile Recovery
Bitcoin is attempting to stabilize after weeks of heavy selling pressure, but the weekly structure still reflects a market fighting to reclaim lost ground. BTC is trading near $91,075 after printing a sharp weekly pullback, reinforcing that volatility remains elevated even as price tries to base. The recent rebound from the sub-$85,000 region shows buyers stepping in aggressively, yet the recovery still looks fragile while broader macro uncertainty keeps risk appetite limited across crypto.

From a technical perspective, Bitcoin is hovering around the zone where previous support has flipped into resistance. Price is currently sitting near the rising 100-week moving average (green), which is acting as a key pivot for bulls. Holding above this level would signal that demand is strong enough to absorb supply during dips. However, the 50-week moving average (blue) has rolled over and remains above price, highlighting that the broader trend has not fully reset bullish momentum.
The 200-week moving average (red) continues to trend higher far below current levels, confirming the long-term uptrend remains intact. For now, the market likely needs a clean weekly reclaim above $95,000 to shift sentiment. Until then, this bounce risks being treated as corrective rather than trend-confirming.
Featured image from ChatGPT, chart from TradingView.com
https://cryptoslate.com/feed/
NYSE said it is developing a platform for trading and on-chain settlement of tokenized securities, and will seek regulatory approvals for a proposed new NYSE venue powered by that infrastructure.
According to the owners, ICE, the system is designed to support 24/7 operations, instant settlement, orders sized in dollar amounts, and stablecoin-based funding. It combines NYSE’s Pillar matching engine with blockchain-based post-trade systems that have the capability to support multiple chains for settlement and custody.
ICE did not name which blockchains would be used. The company also framed the venue and its features as contingent on regulatory approvals.
The scope ICE described is U.S.-listed equities and ETFs, including fractional share trading. It said tokenized shares could be fungible with traditionally issued securities or natively issued as digital securities.
ICE said tokenized shareholders would retain traditional dividends and governance rights. It also said distribution is intended to follow “non-discriminatory access” for qualified broker-dealers.
The forward-looking market-structure implication sits less in the token wrapper and more in the decision to pair continuous trading with immediate settlement.
Under that design, the binding constraint shifts from matching orders during a session to moving money and collateral across time zones and outside banking hours (inference based on settlement and operating-hour constraints described by regulators and ICE).
U.S. markets only fairly recently completed the move from T+2 to T+1 settlement, effective May 28, 2024, a project the SEC tied to updated rules for clearing agencies and broker-dealers. FINRA has also issued reminders that even a one-day compression requires coordinated changes in trade reporting and post-trade workflows.

Always-on trading raises settlement and funding demands
Pressure for longer trading windows is also building in listed equities, with Nasdaq publicly described as seeking SEC approval for a 23-hour, five-day trading schedule. ICE’s proposal extends the concept by pairing always-available trading with a settlement posture it labeled “instant.”
That approach would require market participants to pre-position cash, credit lines, or eligible on-chain funding at all times (inference grounded in the “instant settlement” and 24/7 features, and the post-trade funding constraints reflected in the T+1 migration).
For broader context on how quickly tokenization is spreading in finance, see CryptoSlate’s coverage of tokenized assets.
ICE made the funding and collateral angle explicit, describing the tokenized securities platform as one component of a broader digital strategy. That strategy also includes preparing clearing infrastructure for 24/7 trading and potential integration of tokenized collateral.
ICE said it is working with banks including BNY and Citi to support tokenized deposits across ICE’s clearinghouses. It said the goal is to help clearing members transfer and manage money outside traditional banking hours, meet margin obligations, and accommodate funding requirements across jurisdictions and time zones.
That framing aligns with DTCC’s push around tokenized collateral. DTCC has described collateral mobility as the “killer app” for institutional blockchain use, according to its announcement of a tokenized real-time collateral management platform.
A near-term data point for how quickly tokenized cash-equivalents can scale sits in tokenized U.S. Treasuries. RWA.xyz displays the total value of $9.33 billion as of press time.
ICE’s emphasis on tokenized deposits and collateral integration creates a path where similar assets become operational inputs for brokerage margin and clearinghouse workflows. That scenario is an inference grounded in ICE’s stated clearing strategy and DTCC’s collateral thesis, including the focus on mobility.
| Plumbing shift | Metric | Value | Source |
|---|---|---|---|
| U.S. equities settlement cycle | Compliance date | May 28, 2024 (T+1) | SEC, FINRA |
| Tokenized Treasuries | Total value (displayed) | $8.86B (as of 01/06/2026) | RWA.xyz |
Stablecoins, tokenized deposits, and collateral mobility
For crypto markets, the bridge is the settlement asset and the collateral workflow. ICE explicitly referenced stablecoin-based funding for orders and separately referenced tokenized bank deposits for clearinghouse money movement.
One base-case scenario is a settlement-asset race where stablecoins and bank-issued tokenized deposits compete for acceptance in brokerage and clearing operations. That could push more institutional treasury activity into on-chain rails while keeping the compliance perimeter centered on broker-dealers and clearing members.
A second scenario is collateral mobility spillover, where tokenized collateral becomes a primary tool for intraday and overnight margining in a 24/7 environment. That shift could increase demand for tokenized cash-equivalents such as Treasury tokens that can move in real time under defined eligibility rules.
In that design, the operational question becomes which chains, custody arrangements, and permissioning models satisfy broker-dealer requirements. ICE said only that the post-trade system has the capability to support multiple chains and did not identify any specific network.
A third scenario reaches Bitcoin through cross-asset liquidity. Always-available equities and ETFs, paired with faster settlement expectations, could compress the boundary between “market hours” and “crypto hours,” making funding conditions a more continuous input into BTC positioning (scenario inference anchored to ICE’s 24/7 equities and ETF scope and the mechanics of TradFi access via ETF wrappers).
Farside data shows large daily net flows into U.S. spot Bitcoin ETFs on several early-January sessions, including +$697.2 million on Jan. 5, 2026, +$753.8 million on Jan. 13, 2026, and +$840.6 million on Jan. 14, 2026.
That channel transmits equity-like allocation decisions into BTC exposure, alongside other flow drivers covered in CryptoSlate’s ETF inflows reporting.
Why macro and regulation will shape the rollout
Macro conditions set the incentive gradient for these plumbing changes because collateral efficiency matters more when rate policy and balance-sheet costs shift. The OECD’s baseline projects the federal funds rate will remain unchanged through 2025 and then be lowered to 3.25–3.5% by the end of 2026.
That path can reduce carry costs while leaving institutions focused on liquidity buffers and margin funding as trading windows lengthen (analysis tied to OECD rates and ICE’s 24/7 clearing focus). Under a 24/7 regime with instant settlement as a design goal, margin operations can become more continuous.
That dynamic can pull attention toward programmable cash movement, tokenized deposits, and tokenized collateral as tools for meeting obligations outside bank cutoffs.
For more on one of the key collateral-like building blocks, see CryptoSlate’s deep dive on tokenized Treasuries.
For crypto-native venues, the nearer-term implication is less about NYSE listing tokens and more about whether regulated intermediaries normalize on-chain cash legs for funding and collateral management. That can affect demand for stablecoin liquidity and short-duration tokenized instruments even if the trading venue remains permissioned (scenario inference based on ICE’s stated objectives).
DTCC’s positioning of collateral mobility as an institutional blockchain use case offers a parallel track where post-trade modernization proceeds through constrained implementations rather than open-access markets. That approach can shape where on-chain liquidity forms and which standards become acceptable for settlement and custody.
ICE did not provide a timeline, did not specify eligible stablecoins, and did not identify which chains would be used. The next concrete milestones are likely to center on filings, approval processes, and published eligibility criteria for funding and custody.
NYSE said it will seek regulatory approvals for the platform and the proposed venue.
The post Wall Street’s secret blockchain platform is coming for your dividends and it’s using stablecoins to do it appeared first on CryptoSlate.
Strategy (formerly MicroStrategy) acquired an additional 22,305 Bitcoin for approximately $2.13 billion between Jan. 12 and Jan. 19, continuing an aggressive accumulation campaign that has absorbed 3.38% of the top crypto's total supply.
That works out to 3.55% of the circulating supply of 19.97 million coins.
The purchases were executed at an average price of $95,284 per bitcoin, according to a Jan. 20 8-K filing with the Securities and Exchange Commission (SEC).
The latest acquisition brings Strategy’s total Bitcoin holdings to 709,715 BTC, a hoard worth roughly $64 billion. The company’s cost basis for the total stack is approximately $53.92 billion, or an average of $75,979 per bitcoin, implying around $10.5 billion in paper gains at current prices.

How Strategy is funding its Bitcoin purchases
While the headline number highlights the company’s relentless buying, the mechanics behind the purchase reveal a significant shift in how Strategy funds its operations.
These latest acquisitions were funded using proceeds from the firm's at-the-market sales of its Class A common stock (MSTR), its perpetual Stretch preferred stock (STRC), and the Series A Perpetual Strike Preferred Stock (STRK).
 According to the SEC filing, the Michael Saylor-led Strategy sold 10,399,650 MSTR shares for approximately $1.8 billion last week. It still has about $8.4 billion worth of shares to fund future BTC purchases.
However, the preferred channel is seeing increased activity.
The filing showed Strategy sold 2,945,371 STRC shares for around $294.3 million (with $3.6 billion shares remaining) and 38,796 STRK shares for $3.4 million (with $20.3 billion shares remaining).
This increased bet shows that the company's attempt to turn its bitcoin treasury strategy into a repeatable “yield SKU” that can sit quietly in brokerage accounts and income portfolios is yielding significant interest.
Notably, this financial engineering has produced four distinct exposure tiers that trade on the Nasdaq exchange. This means investors do not need any BTC know-how to invest, as they can simply buy them through a regular brokerage account.
The product lineup is segmented by risk appetite, offering four distinct ways to play the Strategy trade.
The headline act is the Variable Rate Series A Perpetual Stretch Preferred Stock, or STRC. Marketed explicitly as “short duration high yield credit,” this security currently pays an 11.00% annual dividend in monthly cash installments.
Unlike a standard bond where market forces dictate the yield, STRC is an issuer-managed product. Strategy retains the policy power to adjust the dividend rate to ensure the stock trades near its $100 par value.
Data from STRC.live shows that the firm has accumulated 27,000 BTC from the STRC fundraiser.

Below STRC sits a tiered structure of fixed-rate perpetuals.
For the investor who wants a piece of the equity upside, there is STRK (“Strike”). It pays an 8% annual dividend and is non-cumulative (meaning missed payments are lost forever).
However, it functions as a hybrid, offering convertibility to stock that captures about 40% of the gains if Strategy’s common shares rally.
For the risk-averse income seeker, the company offers STRF (“Strife”). This 10% perpetual preferred cannot be converted to stock, but it sits higher in the capital structure.
It is cumulative, meaning the company must make up any missed dividend payments later. With $1.6 billion remaining in capacity, it represents the most conservative tier.
There is also the STRD (“Stride”) instrument, which matches the 10% yield of STRF but removes the safety net. It is non-cumulative and non-convertible.
If Strategy skips a payment, the investor has no recourse, giving STRD the sharpest risk-reward profile among the fixed-rate options. It has $1.4 billion remaining.
Meanwhile, the company has even opened a European front. Last November, Strategy introduced the Series A Perpetual Stream Preferred (STRE), a euro-denominated security that carries a 10% annual dividend paid quarterly.
This instrument carries sharp teeth regarding non-payment. The dividend is cumulative and increases by 100 basis points per missed period, up to a maximum of 18%.
Institutional investors turn to Strategy's preferred
Strategy's financial engineering product list has successfully courted a demographic that typically shuns crypto: the income tourist.

Data from several institutional filings show that high-income and preferred-focused funds are populating the STRC holders list. The roster includes the Fidelity Capital & Income Fund (FAGIX), Fidelity Advisor Floating Rate High Income (FFRAX), and the Virtus InfraCap U.S. Preferred Stock ETF (PFFA).
Meanwhile, the most striking validation comes from BlackRock. The BlackRock iShares Preferred and Income Securities ETF (PFF) is a massive fund that tracks an index usually dominated by sleepy bank and utility preferreds.
As of Jan. 16, the fund held $14.25 billion in net assets. Inside that conservative portfolio, Strategy’s Bitcoin-linked paper has established a beachhead.
The ETF disclosed a position of approximately $210 million in Strategy’s STRC. It holds another ~$260 million across STRF, STRK, and STRD. In total, BlackRock’s ETF exposure to Strategy preferreds sits at roughly $470 million (or 3.3% of the total fund).
Valentin Kosanovic, a deputy director at Capital B, views this as a watershed moment for digital credit.
According to him:
“This is another clear, factual, unquestionable demonstration of the materialization of the wave of institutionalized legacy BTC-pegged financial products.”
Risks?
The machinery required to sustain these dividends creates a unique set of risks. Strategy is not paying these yields from operating profits in the traditional sense. It is funding them through the capital markets.
The company’s prospectus for STRC states that cash dividends are expected to be funded primarily through additional capital raising, including at-the-market stock offerings.
This creates a circular dependency: Strategy sells securities to buy Bitcoin and then pays dividends on those securities.
Considering this, Michael Fanelli, a partner at RSM US, highlighted several risks associated with this model, including Bitcoin price crashes, the lack of insurance coverage, and the fact that the products are unproven in recessions. He also noted that the perpetual products have no maturity date.
However, Bitcoin analyst Adam Livingston countered that the products are a “mind-bender” for traditional analysts. He argued that “STRC is quietly turning Strategy into a private central bank for the yield-starved world.”
According to him:
“STRC is a coupon-bearing ‘credit rail’ that can absorb fixed-income demand, convert it into BTC at scale, then feed the equity premium that makes the next raise easier, cheaper, and faster. That is a flywheel with a bid inside it.”
The post Strategy just crossed 700k BTC but its “circular” Bitcoin funding loop risks a massive high-yield credit disaster appeared first on CryptoSlate.
https://ambcrypto.com/feed/
![Is Berachain [BERA] setting up a short squeeze after reclaiming $1?](https://ambcrypto.com/wp-content/uploads/2026/01/Erastus-2026-01-20T145630.794.jpg) Berachain rebounds sharply as structure improves and traders eye a decisive breakout zone.
Berachain rebounds sharply as structure improves and traders eye a decisive breakout zone. The MegaETH testnet has demonstrated a block time of 10 milliseconds, which is substantially faster than any other blockchain.
https://beincrypto.com/feed/
Bitcoin has surrendered its 2026 gains, falling approximately 4% in the past 24 hours to around $88,850 as of Wednesday morning Asia time.
The price now sits almost exactly where it closed in 2025, erasing a three-week rally that had briefly pushed the cryptocurrency above $97,000. At the time of writing, the token is attempting to rebound after touching a session low of $87,901.
A Disappointing Year-End for 2025
Bitcoin closed 2025 at approximately $87,000-$88,000, down about 30% from its October all-time high of $126,000 and posting a roughly 6% annual loss. December proved particularly brutal, with the cryptocurrency falling about 22% for its worst monthly performance since December 2018.
The much-anticipated “Santa rally” never materialized. Thin holiday liquidity and a lack of fresh catalysts left the market drifting into the final session of the year. The repeated attempts to reclaim key resistance levels were met with selling pressure.
New Year Rebound: Inflation Relief and Regulatory Hopes
Sentiment shifted dramatically in early 2026. On January 14, the Bureau of Labor Statistics released an inflation report showing prices stabilizing, prompting Bitcoin to surge more than 4% over 24 hours and break above $97,000, levels not seen since mid-November.
Breaking above the $95,000 level, a zone that carries both technical and psychological significance, suggested further upside potential. Optimism around the Clarity Act, which would establish a broad regulatory framework for digital assets, also supported sentiment. However, the Senate postponed its planned markup of the bill to the last week of January, signaling it had not yet secured the necessary votes.
Geopolitical Risk Returns
On January 21, President Donald Trump’s push to acquire Greenland and threats of new tariffs on European allies sent shockwaves through global markets. US benchmark stock indexes sank more than 2%, the VIX touched its highest level since November, and the dollar slid against most major currencies.
Shiyan Cao at hedge fund Winshore Capital told Bloomberg the situation “opened up a tail risk—that people don’t want US assets,” adding that investors must now price in a political risk premium.
The selloff echoed fears from April 2025, when Trump’s sweeping tariff announcement triggered a deep slump in US markets and a massive spike in volatility.
Outlook: Volatility Here to Stay
Bitcoin has now completed a round trip, erasing its year-to-date gains and returning to 2025 closing levels. Additional volatility looms on Wednesday as the Supreme Court hears arguments over Trump’s bid to fire Federal Reserve Governor Lisa Cook.
A deal may eventually defuse the Greenland tension, but it could take months—leaving markets facing heightened volatility in the interim.
For now, the cryptocurrency appears to be stabilizing above $88,000 as traders assess whether this represents a buying opportunity or the start of a deeper correction.
The post Bitcoin Erases Three-Week Rally, Retreating to Year-End Levels appeared first on BeInCrypto.
A little-known Solana token calling itself “US Oil” (USOR) surged more than 150% in 24 hours on Monday, briefly pushing its market capitalization above $40 million, as traders latched onto fresh headlines around the United States selling Venezuelan oil blocks.
The token trended on CoinGecko, even as on-chain analysts and traders warned the rally showed classic signs of a speculative pump.
Geopolitics Turns Into a Tradeable Meme
The surge coincided with heightened geopolitical attention on oil. According to reports, Washington today started selling the seized Venezuelan oil assets.
That macro backdrop appears to have spilled into crypto markets, where traders rapidly attached a political narrative to USOR, despite no verified link to any government oil reserves.
At the height of the rally, USOR traded above $0.04, with daily trading volume approaching $20 million.
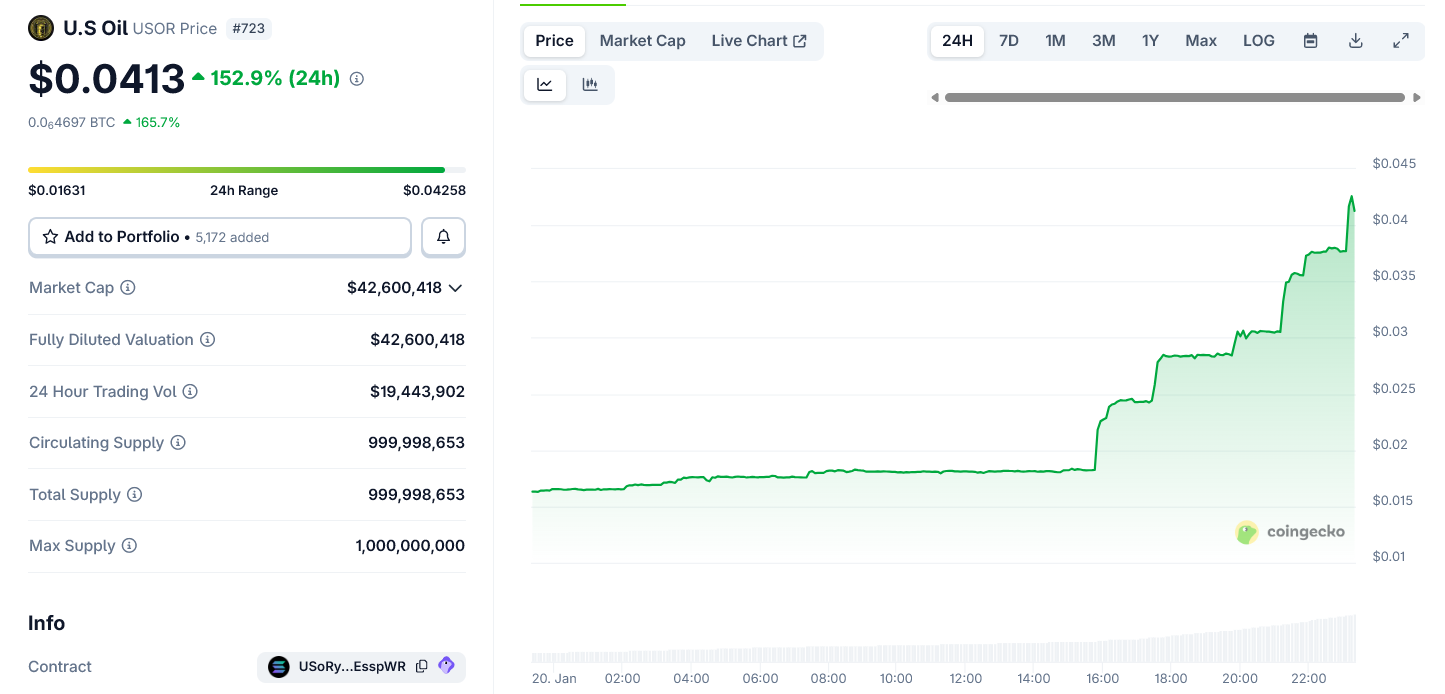
The move unfolded in a near-vertical price pattern, a structure that multiple traders flagged as abnormal.
USOR markets are concentrated on the Solana ecosystem, primarily via decentralized venues such as Meteora. Charting platforms displayed “suspicious chart” warnings as volume spiked sharply alongside price.
The project’s website claims USOR represents an “on-chain reserve index” that tokenizes US oil reserves, describing itself as oil-backed, US-aligned, and governed by public transparency.

However, the site provides no verifiable evidence of custody, legal structure, or linkage to any official US oil reserve infrastructure.
Also, there’s speculation that this token could be an insider move, as it was launched on the same platform as the TRUMP meme coin – Meteora.
Viral Charts, Thin Proof, and Rising Red Flags
Meanwhile, crypto Twitter was filled with sharply divided reactions.
Several crypto traders alleged the narrative was engineered to exploit real-world news, pointing to coordinated promotion, bundled wallets, and a lack of organic accumulation.
Others warned that the token’s branding closely mirrors geopolitical developments to carry out a rug pull.
One widely shared post described USOR as “on-chain exposure to oil reserves from Venezuela,” a claim that has no confirmation from US authorities or energy agencies.
Multiple analysts countered that the timing, branding, and chart structure resembled prior politically themed meme coins that surged on headlines before collapsing.
On-chain data shared by independent trackers showed supply concentration among a small cluster of wallets.
Bubble map visuals circulating on X suggested that many top holders were linked, raising concerns about centralized control and exit liquidity risks for late buyers.
Overall, USOR is another example of how quickly macroeconomic and political news can bleed into crypto speculation.
As the US navigates a complex reset in its Venezuela oil strategy, parts of the crypto market appear eager to financialize the narrative—often without evidence.
Whether USOR proves to be a short-lived meme or something more durable remains unclear. What is clear is that traders are once again racing to trade the story, even as warnings grow louder that the story itself may not hold up.
The post US–Venezuela Oil Moves Ignite Meme Coin Frenzy as ‘USOR’ Surges 150% appeared first on BeInCrypto.
https://cryptonewsz.com/feed/
https://www.newsbtc.com/feed/
Bitcoin has come under renewed pressure after sliding toward the $90,600 region, putting short-term sentiment back on edge. While the move has shaken weak hands, price is now approaching a critical retest zone that could determine whether this dip is merely a shakeout or the start of a deeper correction. How BTC reacts here will likely set the tone for the next directional move.
Bitcoin Slides to $90.6K As Selling Pressure Returns
According to an update by Lennaert Snyder, Bitcoin has extended its downside move, dumping toward the $90,623 level. The latest decline suggests increasing near-term weakness, with expectations that the US market opening could add further pressure and keep sentiment cautious.
Despite the volatility, Snyder emphasizes the importance of patience in such conditions, waiting for clear triggers, especially as the market navigates a fragile structure after the recent sell-off. On the bullish side, a potential scalp setup emerges if BTC manages to break the M15 market structure by reclaiming the $91,265 level. Should this occur, the initial upside target is located near the $93,377 resistance, with the monthly high serving as the ultimate objective if momentum continues to build.

From a bearish perspective, current prices are considered too low to aggressively pursue shorts. Instead, attention shifts to a possible retest of the $93,000 resistance zone, where short positions would only be considered after clear confirmation of rejection.
Looking ahead, a clean reclaim of the $93,377 resistance would signal continuation to the upside and reopen the path toward the monthly highs. However, if no bullish reversal materializes in the near term, Bitcoin may remain range-bound and gradually grind lower through the rest of the week.
Bitcoin At A Crossroads: Two Scenarios In Play
Ardi outlined two possible scenarios for Bitcoin’s next major move, both centered around the key $94,000 resistance zone. This level remains the main decision point that will determine whether the market resumes its broader upside trend or rolls over into deeper downside.
Path A suggests a bullish outcome, where price pushes back into the $94,000 resistance, breaks through with strong acceptance, and continues higher toward the $100,000+ region. In this scenario, the recent downside move would be seen as a shakeout rather than a trend reversal, clearing weak hands before continuation.
However, path B points to another potential fakeout into the $94,000 resistance, only to get rejected once again at the top of the range, followed by a breakdown below $90,000 and a liquidity sweep toward the $88,000 area before the next meaningful move develops.
Both scenarios likely involve a retest of the $94,000 zone. The key difference lies in what happens after that test, whether price acceptance confirms strength, or rejection signals another leg lower.
On Tuesday, Bitcoin (BTC) dipped below the significant $90,000 mark once again, raising concerns about the possibility of entering a new bear market and casting doubt on the cryptocurrency’s prospects. Market analyst Raun Neuner published a new analysis of the situation in a post on X (formerly Twitter).
Is $37,000 On The Horizon?
Neuner highlighted that while stocks are performing robustly and commodities are experiencing what he calls a “supercycle,” the crypto market still struggles to gain traction. This situation raises the critical question: What is the worst-case scenario for Bitcoin?
Historically, Bitcoin’s bull markets tend to peak approximately 532 days after each Halving event. Applying this pattern to the current cycle suggests that Bitcoin could have reached its peak around early October, where it briefly touched $125,000.
Historical trends show that following these peaks, Bitcoin typically endures a substantial decline of 70 to 80%. If this framework holds for the current cycle, Neuner estimates a potential downturn to around $37,000 in the event of a full bear market.
Zooming out to consider broader traditional market dynamics provides further context. After a year marked by strong performances in both stocks and commodities, market corrections are to be expected.
During risk-off periods in equity markets, Bitcoin has historically amplified these downward moves, contributing to building pressure toward the lower end of the spectrum. The analyst indicates that a key reference point for Bitcoin might be around the $57,000 mark, where the 200-week moving average (MA) resides.
Critical Bitcoin Support Levels To Watch
The immediate factors contributing to Bitcoin’s recent drop below the $90,000 threshold are linked to heightened volatility in global bond and equity markets, exacerbated by geopolitical tensions.
Walter Bloomberg, an expert in market analysis, pointed out that the new downtrend has been spurred by various macroeconomic factors, including renewed threats from President Trump regarding tariffs on Greenland and Japan’s fiscal strategies that have added to market instability.
Consequently, investors have turned to safe-haven assets like gold, which recently reached a record price exceeding $4,700. In response, Bloomberg warns that macro risks may be underappreciated.
Demand for downside protection in Bitcoin’s options market is also rising, indicating that investors are aware of the potential for further declines.
The next significant levels for the Bitcoin price in the near term, according to Bloomberg, lie between $84,000 and $85,000, which are expected to act as support for BTC. If the cryptocurrency fails to hold these levels, fears of a deep bear market may become more pronounced.
Featured image from DALL-E, chart from TradingView.com


