Financial RSS Feeds
https://www.investing.com/rss/news.rss
https://cointelegraph.com/rss

The preliminary injunction against the predictions market platform came at the request of Massachusetts Attorney General Andrea Joy Campbell.

Michael Selig named two people as senior advisers, one of whom helped with a law firm‘s letter that led to an SEC no-action letter on crypto custodians.
https://www.coindesk.com/arc/outboundfeeds/rss/
https://cryptobriefing.com/feed/
The commitment to adding seized Bitcoin to reserves may influence global digital asset strategies and impact future crypto regulations.
The post Trump’s Treasury Secretary Bessent reiterates commitment to adding seized Bitcoin to strategic reserve appeared first on Crypto Briefing.
PayPal confirms crypto users must report taxes under new IRS rules, with Form 1099 DA issued for digital asset sales starting in 2025.
The post PayPal outlines new tax reporting requirements for crypto users appeared first on Crypto Briefing.
https://bitcoinist.com/feed/
Bitcoin’s dominance over the broader crypto market has become the main reference point for traders trying to determine when an altcoin season will finally take shape. At the moment, Bitcoin still controls close to 60% of the total market, and this has so far kept any meaningful altcoin breakout at bay.
However, according to a Bitcoin analyst, history suggests that once this balance begins to shift, the transition into altcoin season tends to happen quickly, often playing out within a tight one-to-two-month timeframe.
Why Bitcoin Dominance Matters For Altcoin Season
In his analysis, the analyst explained that Bitcoin dominance, also known as BTC.D, is an important factor in determining when capital begins rotating into altcoins. BTC dominance measures Bitcoin’s share of the total crypto market capitalization, and declines in this metric have historically coincided with explosive altcoin rallies. At the time of writing, CoinMarketCap puts the Bitcoin dominance at 59%.
Looking back at 2017, the BTC.D chart shows Bitcoin’s dominance falling very quickly from around 96% in early March to about 60% by mid-May. That drop was the playout of one of the most aggressive altcoin rallies the market has ever seen.

A similar pattern played out in 2021, when BTC dominance fell from about 60% in early April to near 40% by mid-May. That move coincided with another powerful altcoin expansion, pushing Ethereum and several other major altcoins to new all-time highs. Many of those peaks, particularly among meme coins such as Dogecoin and Shiba Inu, are unbroken to this day.
The most important takeaway from both cycles, according to the analyst, is the speed of the move. In each case, it took just one to two months for a full-blown altcoin season to unfold once Bitcoin dominance began rolling over decisively.
BTC’s Next Move Could Decide Everything
The analyst notes that many investors underestimate how quickly this transition can happen. After waiting through multiple years of accumulation and consolidation, market participants often grow impatient just before the final stage. Historically, however, altcoin season has tended to play out very quickly once conditions align, not gradually over many months. Therefore, investors waiting for an altcoin season can still hold on for that move and not lose focus.
He also pointed to macro signals supporting a risk-on environment, referencing strength in assets such as small-cap equities, gold, and silver hitting all-time highs. These conditions are lining up for capital flowing into higher-beta assets once confidence returns.
Nonetheless, altcoins cannot sustain a true breakout without BTC first making a convincing move. If Bitcoin fails to push to a new all-time high, altcoins may see only short-lived relief rallies. On the other hand, a new Bitcoin all-time high could act as the deciding factor that brings retail traders back into the market and eventually leads to FOMO plus a breakout altcoin season.
In the current market structure, the Ethereum price continues to move in a separate direction from its network’s performance and fundamentals. While ETH’s price struggles to initiate a major rally, the network is performing at a remarkable pace, breaking past prior all-time highs in most aspects of the blockchain, such as staking.
More Ethereum Getting Locked Away
Even in the ongoing crypto volatile landscape, the supply dynamics of Ethereum, the second-largest cryptocurrency asset, are undergoing a quiet but meaningful shift. Currently, ETH staking is experiencing exponential growth, leading to a tightening supply as more ETH gets locked away.
Milk Road, a market expert, stated that ETH is becoming intentionally harder to access in the midst of the strong growth in its staking ecosystem. The chart shared by Milk Road shows that ETH staking has now hit a new all-time high, with millions of the altcoin presently scheduled to be locked away.

While more tokens are being locked into validator contracts, an increasing percentage of Ethereum’s total supply is essentially taken out of daily circulation. The supply of ETH taken by staking has never been this high, snatching over 30% of the entire supply in circulation.
This points to growing confidence in staking as a yield strategy in the long term and a deeper commitment to the security offered by the network. Meanwhile, the Ethereum network is now secured by approximately $120 billion worth of staked ETH.
In addition to being removed from active circulation, Milk Road highlighted that this supply is also taken off crypto exchanges. When staking rises, and supply shrinks, Mlik Road stated that this trend is a positive signal for price appreciation in the long term, reinforcing the expert’s conviction in ETH to move higher.
A Sharp Rise In ETH’s Network Activity To New Highs
On-chain activity has experienced a similar growth, rising to historical levels. Crypto Tice reported that Ethereum network activity is at an all-time high, highlighting the blockchain’s rising function as the layer of settlement for cryptocurrency and financial operations.
The network growth is observed among new wallet addresses, of which more than 393,000 new wallets were created in a single day, reaching the highest level ever recorded for the 7-day average of daily wallet creation. Such an increase in activity is noteworthy not only for its magnitude but also for its tenacity, occurring despite the continued volatility of the market.
It is worth noting that these types of growth are subtle as they do not show up at the tops, and momentum is gradually picking up again. However, when it does show up, it is accompanied by a quiet spike in adoption beneath the surface; a clear instance of how increasing demands follow an expansion in usage.
At the time of writing, the ETH price was trading at $3,119, demonstrating a nearly 3% decline in the last 24 hours. Its trading volume is also showing bearish performance, dropping by more than 16% over the past day.
https://cryptoslate.com/feed/
Analog January is meeting Bitcoin at the custody layer as some investors seek exposure without screen time.
The digital-minimalism push, framed as “tech-low and slow living,” is landing as crypto returns to a volatility regime that makes constant checking expensive.

Livingetc reported that “Analog January” (sometimes shortened to “Janalog”) is a reset from compulsive micro-checking rather than a move off-grid, quoting productivity specialist Emily Austen in a piece published Jan. 7, 2026.
In parallel, markets swung through a liquidation cascade, with 24-hour liquidations at $874 million and Bitcoin peaking near $95,000 before reversing as major tokens opened lower.
The overlap between a “check less” cultural reset and a “move fast” trading tape is turning custody into a lifestyle variable.
Investors already have tools that reduce attention, such as index funds or ETF wrappers, but most crypto interfaces still nudge users toward prices, alerts, and leverage.
Bitcoin is unusual among widely traded assets because its low-touch mode is not a platform feature; it is a custody choice.
Holders can self-custody in cold storage, keep keys off connected devices, and verify ownership without maintaining a perpetual account relationship with a broker or exchange.
That makes it legible as an “anti-screen” store-of-value posture in a way that looks closer to a vault than an app.
What this means for adoption, culture, and the next phase of crypto infrastructure
ETF flows show the other side of the same behavior, reducing touchpoints by delegating custody and execution.
Spot Bitcoin ETFs saw $394.7 million of net outflows yesterday, while spot Ethereum ETFs recorded $4.64 million of net inflows.

The figures do not map one-to-one to on-chain transfers, but they show that “set-and-forget” can mean convenience through regulated wrappers just as easily as sovereignty through keys.
They also show flows can pivot even during a culture moment built around stepping away from screens.
Hardware wallets sit at the center of the offline custody pathway, and the market is scaling beyond early-adopter cycles.
According to Mordor Intelligence, the hardware wallet market is valued at $0.56 billion in 2026, estimated at $0.72 billion by the end of the year, and forecast to reach $2.58 billion by 2031.
That implies a 29.05% compound annual growth rate from 2026 through 2031.

The trajectory suggests supply chains, retail distribution, and support infrastructure that can absorb demand bursts when volatility or security headlines push users toward cold storage, rather than constraining adoption to specialist circles.
| Metric | Figure | Timeframe |
|---|---|---|
| Liquidations | $874.01M | 24 hours |
| Spot Bitcoin ETF net flow | -$394.7M | Same window |
| Spot Ether ETF net flow | +$4.64M | Same window |
| Hardware wallet market | $0.72B | 2026 estimate |
| Hardware wallet market | $2.58B | 2031 forecast |
| Crypto stolen | $2.2B | H1 2025 |
| Thefts targeting individuals | 23% | H1 2025 |
Security is the other structural driver for going offline
The Financial Times reported demand for secure crypto devices as hacks hit record levels, citing Chainalysis data that $2.2 billion was stolen in the first half of 2025, with 23% of thefts targeting individual wallets.
The report also noted that Ledger’s revenue reached “triple-digit millions” in 2025.
Beyond hacks and phishing, crypto holders are increasingly facing real-world violence designed to bypass even the strongest wallet security. These incidents, often referred to as “$5 wrench attacks,” involve criminals using threats, kidnapping, home invasions, or torture to force victims to hand over seed phrases or authorize on-chain transfers, which are typically irreversible once sent.
CryptoSlate has reported on a growing pattern of attacks across 2024 and 2025, including cases where victims were specifically targeted after their identities, addresses, or holdings were exposed through data leaks or doxxing, and even situations where attackers posed as delivery workers to gain access.
The rise in these crimes is pushing some high-net-worth investors to adopt more aggressive personal security measures and rethink how publicly they discuss crypto wealth, because in the self-custody era, the weakest link is often no longer the code, but the person holding the keys.
For this reason, wallets that allow multiple accounts with separate PIN codes are preferred, as they allow holders to create “distress” or “honey-pot” wallets to avoid losing everything in the event of a physical attack. Users split holdings across distinct pin codes to be compliant with attackers without giving the keys to every sat.

That backdrop turns self-custody from an identity choice into an operational choice because the attack surface for individuals sits at the intersection of always-connected devices, phishing vectors, and hurried transaction signing.
Whether the analog mood is converting into custody behavior can be tracked with public indicators that move faster than quarterly surveys.
Google’s Trends' Trending Now experience uses a forecasting engine that refreshes every 10 minutes, allowing short-window comparisons between terms tied to digital fatigue (“Analog January,” “digital detox”) and terms tied to offline security (“hardware wallet,” “cold storage,” “seed phrase”).
Past the attention layer, intent can be watched through exchange-balance proxies
CryptoQuant’s Exchange Reserve is defined as the total coins held on exchanges, a series market participants often use as a proxy for potential sell-side inventory and post-shock transfers into longer-term storage.
Volatility can also be anchored in a forward-looking measure rather than spot swings.
According to CF Benchmarks, the CME CF Bitcoin Volatility Index (BVX) is a 30-day constant-maturity implied volatility measure derived from CME Bitcoin and Micro Bitcoin options.
When implied volatility reprices, hedging costs, and the day-to-day friction of monitoring positions reprice with it, which is where a “check less” habit and “hold offline” tools can converge into observable shifts in custody and flow.
Bitcoin fits the ‘Analog January' mindset more cleanly than most large-cap tokens because its store-of-value framing maps onto cold storage workflows.
Ethereum can still see the same custody reflex, especially for holders who want safer transaction signing, even if its usage narrative is tied to application interaction.
XRP is closer to rails, where an “anti-screen” posture leans toward automation and settlement rather than vault storage, even when broader risk-off conditions hit multiple tokens at once.
The post Analog January has people worldwide quietly moving offline, and the biggest Bitcoin risk isn’t price volatility appeared first on CryptoSlate.
In the latest SlateCast, Liam “Akiba” Wright and Nate Whitehill sat down with Maximiliano Stochyk Duarte to unpack what makes token launches succeed as the market heads into 2026. Duarte argued that the bar has risen: retail attention is harder to earn, and projects without a real business model risk failing quickly.
CoinTerminal’s launchpad pitch
Wright introduced Duarte as Head of Sales at CoinTerminal, a Dubai based Web3 fundraising platform positioned around “raise capital transparently” while “giving retail investors fair access to early stage token deals.”
Pressed to translate that into day-to-day work — “What do you do when you wake up and get outta bed?” — Duarte said his core job is talking with teams preparing to launch and helping them structure what the token needs to succeed. He stressed that product traction alone doesn’t guarantee a healthy launch: “And even if you have a great product, usually the token is like a separate product.”
Fundraising is central, but Duarte framed CoinTerminal as both capital formation and distribution. “We have a 650,000 user. Community that basically they're able to contribute into the sales before they go out on exchanges,” he said, adding that founders also want exposure and “buying pressure into their token.”
Why 2026 feels different
Duarte told the hosts the market has become more selective, starting with capital formation: raising is “not that easy as it was like a couple of years ago.” He also pointed to regulation as a growing force around launches, while noting that projects come to market for different reasons — sometimes utility, sometimes simply money.
He repeatedly returned to the same friction point: attention and trust. Narratives can burn out quickly, he said, pointing to how “AI” became a label slapped onto everything without sustaining retail interest, before summarizing the new standard bluntly: “Retail is becoming much more do I want this token?”
That shift forces tougher screening. Duarte warned that many teams still lack a revenue model or durable plan after raising, and argued the industry needs a balance — more crypto-friendly conditions can also invite “bad actors” that push retail away if risk feels unmanaged.
What CoinTerminal screens for in launches
Whitehill asked what “real product market fit” looks like for a launchpad and which metrics matter most. Duarte described a practical filter: backers as social proof (while acknowledging many projects are bootstrapped), KOL strategy where “it's not about the quantity, it's about the…quality,” and a narrative paired with an actual path to sustain the product.
He also emphasized how exchanges and token structure shape day-one outcomes. For “non-negotiable” signs, Duarte led with “good exchanges,” saying valuation should match venue — at higher valuations, “we do expect Tire one exchanges,” while lower valuations can fit “tire two or tire three.” From there, he pointed to unlocks and vesting, arguing that tiny TGE unlocks can leave users negative even if the token performs, and said CoinTerminal often pushes founders to adjust these parameters.
The refundable model and retail protection
Wright’s curiosity peaked around CoinTerminal’s refund structure, asking how it works and whether it helps protect retail. Duarte described a “12 hour refundable period” after token launch where a participant must choose to claim or refund based on early price action, calling it “risk-free” from the user’s perspective.
But he also framed it as a discipline mechanism for founders. “In our case, you claim the whole thing or you refund the whole thing,” he said, rejecting partial-claim models as unfair. Duarte added that refundable sales can attract more contributions because the risk profile is different, while refunds reduce the final amount raised if performance disappoints.
Utility, incentives, and when to launch
Whitehill pressed on token utility beyond governance. Duarte said he likes models where “companies have like revenue and they're like sharing the revenue to like different token holders,” but acknowledged utility is “a tricky one” because discounts and common perks often don’t convince retail.
Wright widened the lens to longer cycles and how investors should judge whether a token is merely depressed with broader conditions or fundamentally fading. Duarte’s checklist centered on execution: what the team is building, whether updates continue, and how unlocks and runway affect survival — especially for projects without a business model.
To close, Whitehill asked whether founders overthink bull-versus-bear timing. Duarte agreed markets matter but warned against endless delay: “I think timing is important,” he said, adding that teams can still fail in good conditions if token metrics are wrong.
The episode’s throughline was clear: in 2026, launches will be judged less by hype and more by alignment — between product, token structure, and the expectations of the retail buyers founders still need to earn.
The post CoinTerminal’s Max Stochyk Duarte on token launches, retail protection, and surviving 2026 appeared first on CryptoSlate.
https://ambcrypto.com/feed/
 Ethereum consolidates between $3,000 and $3,390, with fading momentum and no bullish breakout confirmation.
 The Taker Buy/Sell Ratio showed that the 90-day taker aggression Z-score reached -1.81.
https://beincrypto.com/feed/
Gold surged, oil slumped, and Bitcoin stalled in 2025. At the same time, corporate treasuries quietly bought tens of billions of dollars’ worth of crypto. Together, these moves explain how tariffs, liquidity, and institutional behavior reshaped markets entering 2026.
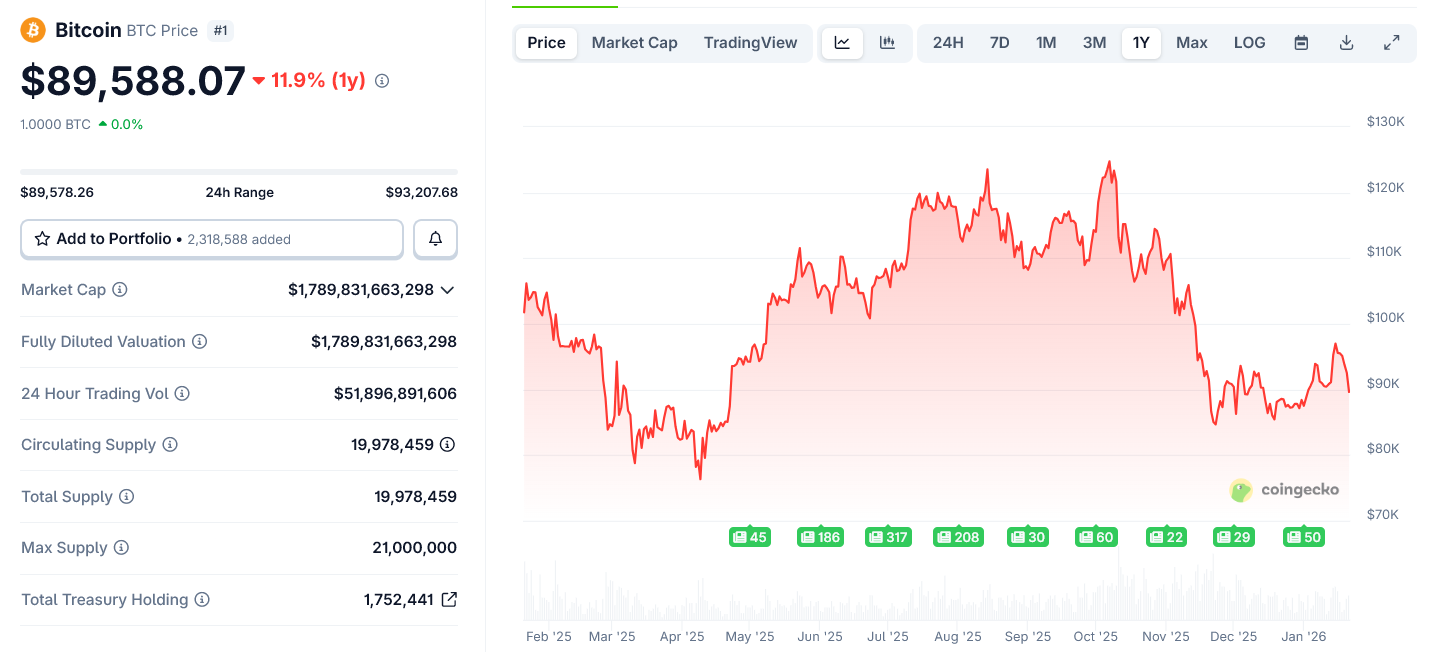
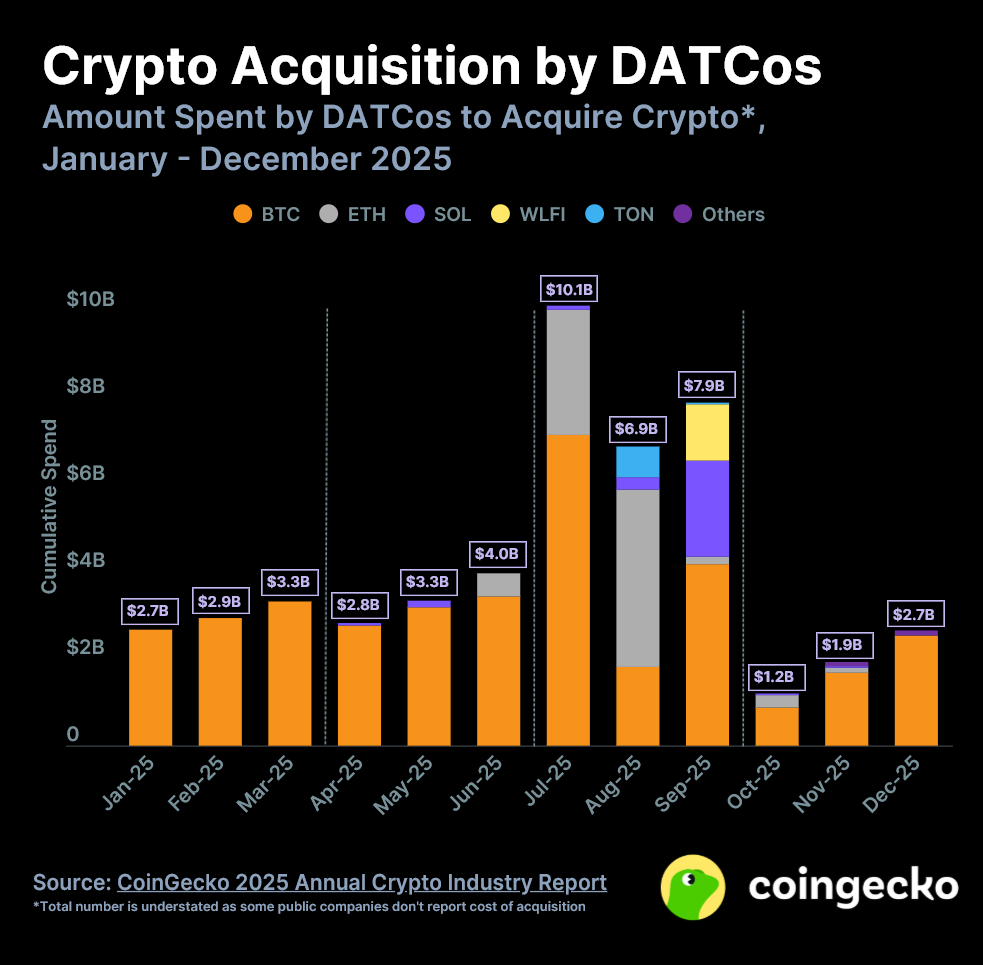
Data from CoinGecko shows a year of sharp contrasts. Gold rose 62.6%, oil fell 21.5%, and Bitcoin ended down 6.4%. Yet Digital Asset Treasury Companies (DATs) deployed nearly $50 billion into Bitcoin and Ethereum, taking control of more than 5% of the total supply.
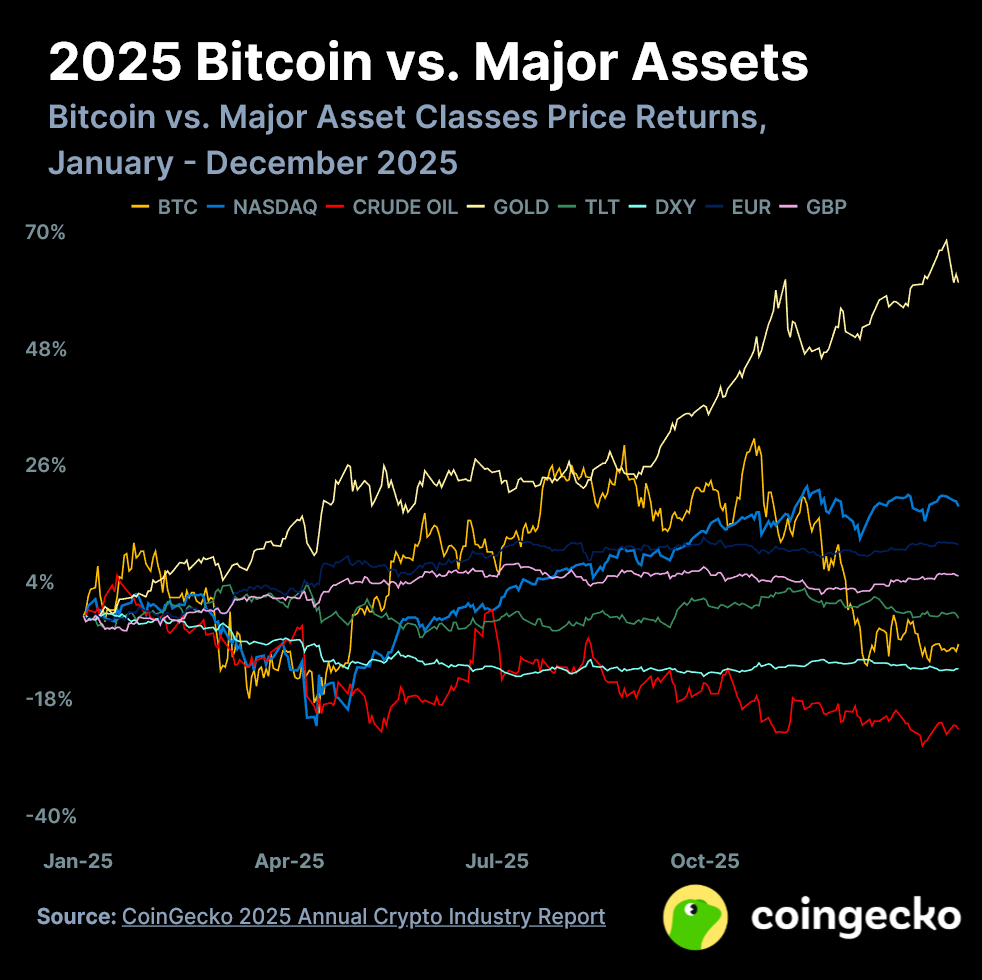
Gold Thrived as Tariffs Amplified Uncertainty
Gold’s outperformance aligned with a tariff-heavy environment. Trade barriers increase uncertainty, weaken confidence in long-term currency stability, and encourage defensive positioning. Gold benefits immediately from that mix.
Unlike growth assets, gold does not require expanding liquidity to rally. It responds to policy risk and geopolitical stress. With tariffs escalating and global trade friction rising, gold became the default hedge.
Oil Absorbed the Growth Shock As Bitcoin Stalled
Oil told the opposite story. Tariffs slow trade, compress manufacturing activity, and reduce shipping volumes. That directly hits energy demand.
Crude prices fell 21.5% in 2025 as supply stayed ample and non-OPEC production climbed. In tariff regimes, oil behaves like a growth proxy—and growth cooled.
Bitcoin’s -6.4% year reflects a tug-of-war. Tariffs created uncertainty that should favor hedges, but they also drained discretionary liquidity. At the same time, U.S. inflation stayed moderate but sticky, keeping financial conditions tight.
The result was a long consolidation after October’s liquidation shock. Bitcoin did not collapse like oil, nor did it rally like gold. It waited for liquidity pressure to stop intensifying.
Fiat Pressure Stayed Contained, For Now
Despite tariffs acting as a slow domestic tax, inflation remained controlled. Costs were absorbed gradually by importers and retailers, delaying pass-through to consumers. That kept fiat stress muted in headline data, even as purchasing power eroded quietly.
This “slow burn” capped risk appetite without triggering panic—another reason crypto range-bound rather than broke down.
Treasury Buyers Accumulated Through the Reset
While prices struggled, DATs bought aggressively. They spent $49.7 billion in 2025, with roughly half deployed in the second half of the year. Their holdings rose to $134 billion by year-end, up 137% year over year.
This behavior signals long-term conviction. Treasury buyers accept volatility to secure supply. Their accumulation during a down year concentrated Bitcoin and Ethereum in strong hands and tightened available float.
Overall, 2025 was a year of compression for crypto markets. Tariffs favored gold, hurt oil, and delayed Bitcoin’s cycle by draining liquidity. Meanwhile, institutions built positions quietly.
As tariff pressure stopped worsening and selling pressure faded, Bitcoin began to move again. The market enters 2026 with tighter supply, stronger holders, and a clearer path for expansion once liquidity improves.
The post Gold Beat Bitcoin, Oil Crashed, But Smart Money Kept Buying Crypto appeared first on BeInCrypto.
USDT prices in Venezuela dropped sharply as demand for the stablecoin eased, narrowing the gap with the Central Bank’s official exchange rate. The move reflects shifting market expectations around greater foreign currency availability following recent US intervention.
Analysts warn the adjustment may be temporary, as it has not translated into lower living costs and remains unsupported by sustained foreign investment or structural inflows.
Dollar Demand Eases Amid Policy Signals
The price of USDT in Venezuela has fallen by over 40% in the past 10 days, surprising the local market. Meanwhile, the exchange rate gap has narrowed to almost 31%.
The country has experienced great political instability since the start of the year. Three days into January, the American capture of Venezuelan strongman Nicolás Maduro injected uncertainty into the markets over what the future of the government would look like.
Venezuelans have since reacclimated themselves to a new normal. Now, with former vice president Delcy Rodríguez in charge, the government has signed several new oil agreements with the United States.
With the prospect of greater foreign currency supply and international investment, dollar demand, as measured by USDT, has waned.
On the surface, the data reflect expectations of increased foreign exchange supply and tentative signs of economic normalization.
Nonetheless, other factors may be at play that partially explain this shift.
Market Correction Masks Ongoing Economic Strain
Ongoing bolívar instability, combined with capital controls and limited access to stable foreign currencies, has driven widespread cryptocurrency adoption in Venezuela. Cryptocurrencies are commonly used to pay salaries and facilitate everyday purchases of goods and services.
Because of this, stablecoins, more specifically USDT, have become the reference point for dollar demand in Venezuela.
Over the past two days, USDT fell below 500 bolivars on P2P platforms for the first time since December. The data indicates that buyers are no longer competing aggressively for dollars. Meanwhile, sellers are more willing to accept lower prices.
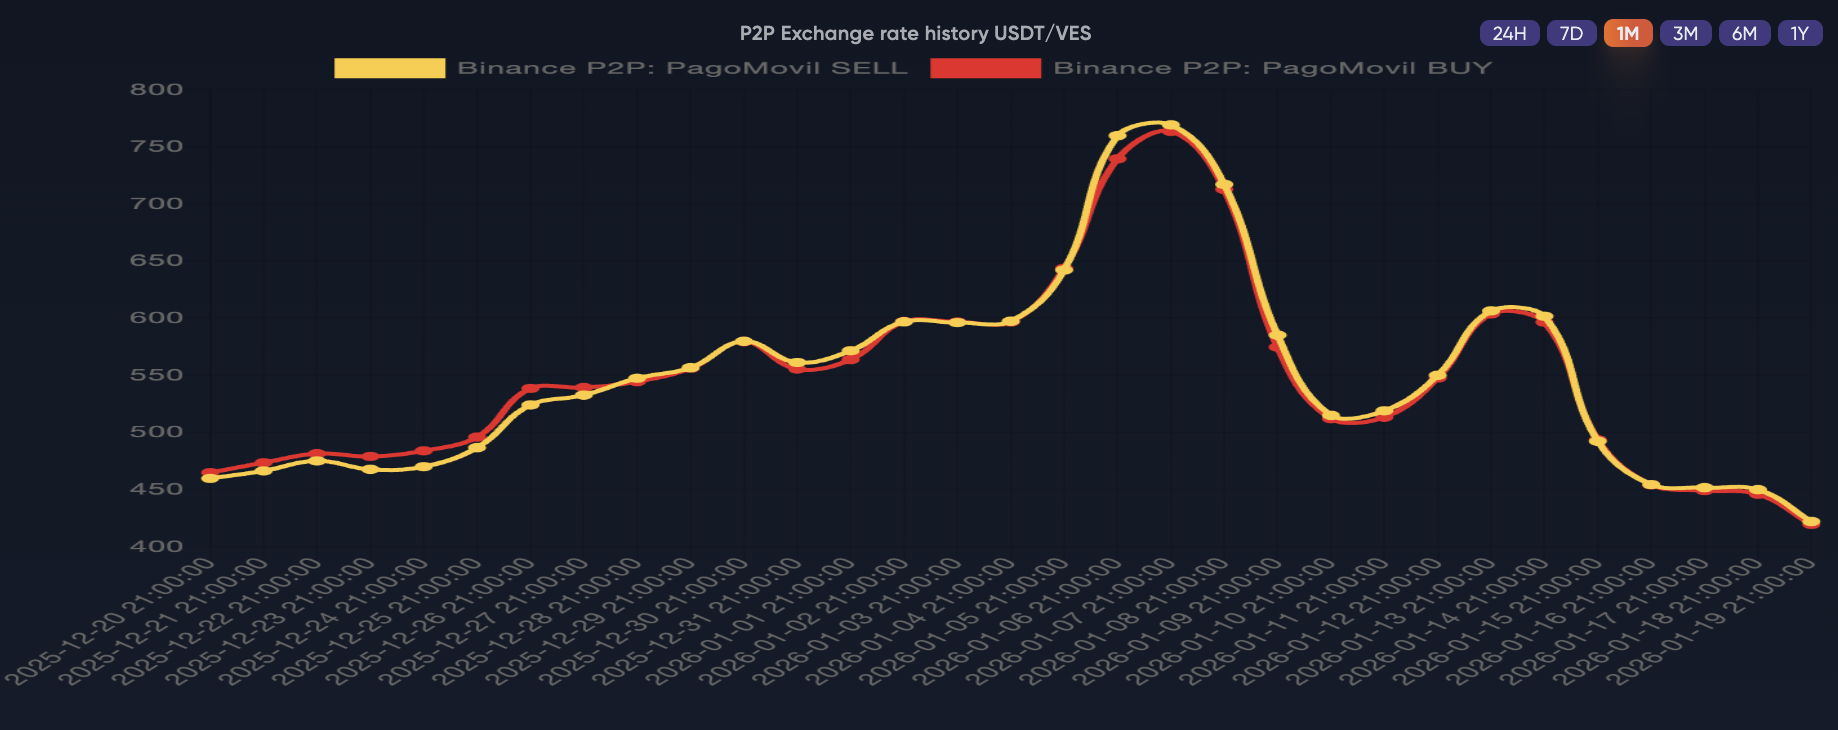
Because P2P markets in Venezuela reflect real household and business demand, this move signals a temporary easing of dollar scarcity and a reduction in fear-driven pricing.
However, it does not indicate improved purchasing power or lower inflation. Although the exchange rate gap has narrowed significantly, food and service prices continue to rise, generating a strong perception of economic disconnection.
The bigger question now is whether the decreased demand represents a structural change or just a momentary respite.
Without sustained capital or export revenues, the current balance could quickly unravel. Any lasting stabilization will depend on deeper structural reforms and a steady supply of external funding.
The post Demand for USDT Drops in Venezuela: Is the Economy Stabilizing? appeared first on BeInCrypto.
https://cryptonewsz.com/feed/
https://www.newsbtc.com/feed/
XRP lost the $2 level after the broader crypto market suffered sharp declines on Monday, dragging price action back into a fragile zone. While the move rattled traders, Binance derivatives data suggests the sell-off has not triggered an extreme leverage unwind yet. Instead, the market appears to be entering a transitional phase where risk is rising, but speculative behavior remains relatively controlled.
Open interest metrics show a delicate balance between positioning and price weakness. Total XRP open interest on Binance climbed to roughly $566.48 million, pushing above the 30-day average near $528.84 million. This spread implies that fresh positions are still being added despite the downturn, but the pace looks measured rather than euphoric. In other words, traders are stepping in cautiously, not flooding the market with aggressive leverage.
The 30-day rolling Z-Score framework helps contextualize this shift. With open interest expanding while volatility stays contained, XRP may be building the conditions for a larger move ahead. For now, however, price remains vulnerable, and the next direction will likely depend on whether liquidity returns or fear deepens.
Open Interest Volatility Rises as XRP Builds Toward a Bigger Move
Arab Chain’s CryptoQuant read shows the most important shift isn’t the headline open interest figure, but the instability underneath it. The 30-day standard deviation of XRP open interest (oi_std30) has climbed to roughly $65.7 million, marking its highest level since November. That matters because it signals open interest is starting to swing more aggressively around its average, a pattern that often shows up before price leaves a tight range and enters expansion mode.

At the same time, the leverage signal still looks contained. The Z-Score holds near 0.57, signaling an elevated but not extreme level. In practical terms, positioning is growing, but it doesn’t look like the market is overheating or entering the kind of reckless leverage phase that typically leads to instant liquidation cascades. That combination—rising volatility in positioning while the Z-Score remains moderate—suggests momentum is building without a clear directional commitment yet.
This puts XRP in a “risk-on, but cautious” environment. Traders are adding exposure, volatility is creeping higher, and the setup is becoming more reactive. From here, oi_std30 becomes a key metric to track alongside price structure, because whichever way price breaks, the market is increasingly positioned for a larger move.
XRP Slides Back Toward $1.90 as Bears Keep Control
XRP remains under heavy pressure, with the chart showing price slipping back toward the $1.90 zone after failing to hold the $2 level. The market is printing a clear sequence of lower highs and lower lows, confirming that the broader trend is still bearish despite several short-lived rebounds over recent weeks. Each time XRP attempts to recover, sellers quickly step in and cap momentum before it can reclaim key resistance levels.

The latest move highlights this weakness. XRP briefly pushed higher in early January but immediately rolled over, showing that demand is still too soft to sustain a breakout. The $2.00 region has now flipped into overhead resistance, and price will likely need a strong bullish catalyst to break back above it with conviction.
From a structure perspective, the current support area sits around $1.85–$1.90, which has acted as a short-term floor during the recent consolidation. If this zone fails, XRP could quickly revisit lower liquidity pockets, extending the downtrend.
Volume also reflects uncertainty. Activity remains erratic despite occasional, isolated spikes. This suggests the market is still reacting to fear-driven flows rather than steady accumulation. Price stalls in a fragile consolidation phase. And bulls need to reclaim above $2 to shift the short-term narrative back in their favor.
Featured image from ChatGPT, chart from TradingView.com
Comparing Dogecoin to NVIDIA may seem illogical at first. One is a speculative digital asset rooted in internet culture, while the other is a leading equity in the AI and tech sector. However, a chart shared by cycle analyst @Cryptollica reframes the comparison by stripping away narrative and focusing on capital flows. Rather than asking which story is more compelling, it examines how money has historically rotated between established market leaders and high‑risk assets as cycles mature.
What The Dogecoin—NVIDIA Chart Is Showing Investors
The chart posted by Cryptollica tracks the DOGE-to-NVIDIA ratio across multiple market cycles, emphasizing relative performance rather than absolute price. This perspective matters because it highlights where capital has generated the highest marginal returns over time. Historically, the ratio has moved within a clearly defined downward channel, with major turning points occurring when the price reaches the lower boundary of that structure.
During both the 2017 and 2021 cycles, the ratio compressed into this same support area. In each case, NVIDIA had already realized significant upside, while Dogecoin remained heavily discounted in relative terms. What followed was not a breakdown in NVIDIA’s price, but a period where Dogecoin significantly outperformed as speculative capital rotated back into higher-risk opportunities.
The current structure mirrors those earlier conditions. The ratio is again testing long-term support, signaling a familiar imbalance: extended gains already priced into NVIDIA, and suppressed relative value in Dogecoin. In previous cycles, this setup preceded sharp shifts in relative performance as liquidity began favoring assets with greater upside sensitivity.
What A Rotation Environment Means For Dogecoin
The pattern highlighted by the chart centers on rotation rather than decline. When leading trades lose momentum, capital typically stays within the market and seeks higher beta exposure. Historically, Dogecoin has benefited during these transitions, serving as a vehicle for speculative flows once dominant growth assets reached saturation.

This does not imply weakness in NVIDIA’s underlying fundamentals. Its valuation remains tied to sustained AI-driven growth expectations. Dogecoin, however, operates under a different dynamic, driven largely by sentiment and liquidity conditions. When markets move from concentration into dispersion, assets like DOGE have previously delivered outsized percentage gains.
The chart suggests that a similar environment may be forming again. At comparable points in past cycles, Dogecoin outperformed after NVIDIA-like leaders had already completed their primary expansion phase. If the ratio holds its historical support, the data points to a renewed window where DOGE could outperform on a relative basis.
Rather than predicting hype-driven rallies, the chart highlights a recurring structural relationship between capital leaders and speculative assets. Whether the pattern repeats will depend on liquidity and risk appetite, but the setup reflects a consistent historical behavior that has appeared more than once across market cycles.


