Financial RSS Feeds
https://www.investing.com/rss/news.rss
https://cointelegraph.com/rss

Need to know what happened in crypto today? Here is the latest news on daily trends and events impacting Bitcoin price, blockchain, DeFi, NFTs, Web3 and crypto regulation.

The product gives retirement investors indirect Bitcoin exposure through a BlackRock index built on the company's spot Bitcoin ETF.
https://www.coindesk.com/arc/outboundfeeds/rss/
https://cryptobriefing.com/feed/
Trump Media sets February 2 2026 as the eligibility cutoff for a digital token airdrop to DJT shareholders using Crypto.com infrastructure.
The post Trump Media sets February 2 record date for digital token airdrop to DJT holders appeared first on Crypto Briefing.
The commitment to adding seized Bitcoin to reserves may influence global digital asset strategies and impact future crypto regulations.
The post Trump’s Treasury Secretary Bessent reiterates commitment to adding seized Bitcoin to strategic reserve appeared first on Crypto Briefing.
https://bitcoinist.com/feed/
Bitcoin has slipped below the $92,000 level after a sharp decline that began on Sunday, signaling that downside pressure is still shaping market conditions. Despite the drop, bulls are trying to defend current levels and regain control, with many traders watching for a rebound that could restore confidence across the broader crypto market. The move comes at a sensitive moment, as risk appetite remains fragile and short-term volatility continues to shake out leveraged positioning.
Top analyst Darkfost highlighted that the market is now 109 days removed from Bitcoin’s last all-time high, placing the current drawdown into a wider cycle context. In previous major corrections, Bitcoin spent far longer in recovery mode, including 236 days between March 2024 and November, followed by another 154-day correction window between December 2024 and May 2025. Compared to those periods, the current pullback may still be early in its timeline, even if price action already feels aggressive.

What makes this correction stand out is the intensity of the pain across the market. Realized losses have stacked up, capitulation has been more visible, and short-term holders appear increasingly stressed, creating the sense that this decline is heavier than past resets. Even so, history suggests Bitcoin can remain in a choppy recovery phase for months without breaking the broader cycle structure.
Capitulation Builds, But the Cycle May Still Be Intact
Bitcoin’s recent decline has not been a “clean” pullback. Realized losses have stacked up, capitulation has looked aggressive, and short-term holders remain under heavy pressure as the market punishes late entries and weak conviction. Liquidation data has also shown how leverage has amplified the downside, with forced selling accelerating drops that might have otherwise played out more gradually. That backdrop is exactly why the correction feels so violent, even compared to past drawdowns.
However, Darkfost argues this phase still fits within the broader rhythm of Bitcoin’s cycle. His key point is that extended corrections are not unusual, even when they feel unusually painful in real time. From that perspective, the market could easily spend more months digesting losses and rebuilding positioning without signaling a full structural breakdown.
Where this cycle becomes more complex is the macro timing. Unlike previous cycles, Bitcoin’s post-bear all-time high and the halving narrative have overlapped with a new variable: ETF-driven demand. That shift changes how drawdowns develop, because deeper pools of institutional capital can absorb supply differently than retail-led rallies. If this institutional trend continues, Bitcoin may be transitioning into a structurally different market regime, with longer consolidations and less predictable “four-year cycle” behavior.
Bitcoin Slips Below Key Averages as Bulls Defend $90K Support
Bitcoin is back under pressure after failing to hold above the $92,000 zone, with the chart showing price sliding toward $91,300 as selling accelerates. The move keeps BTC trapped below major moving averages, reinforcing the idea that this rebound is still fragile and highly reactive to headline-driven volatility. After the January recovery attempt, the rejection near the descending resistance structure highlights that sellers remain active on rallies, limiting bullish follow-through.

Technically, the market continues to trade beneath the 50-day and 100-day trend lines, while the longer-term averages remain overhead, acting as dynamic resistance. This structure suggests BTC is still in a corrective phase rather than a confirmed trend reversal, despite short-term optimism earlier this month. Volume also shows a lack of sustained demand expansion, supporting the view that buyers are defending levels, but not fully regaining control.
The $90,000–$88,000 range now stands out as a critical support area, as it has acted as a base during recent consolidation. A clean breakdown below it could reopen downside risk toward the December lows, while a hold could keep the market building a recovery structure. For bulls, the first step is stabilizing above $92,000 again, then reclaiming the mid-$90,000s to shift momentum back in their favor.
Featured image from ChatGPT, chart from TradingView.com
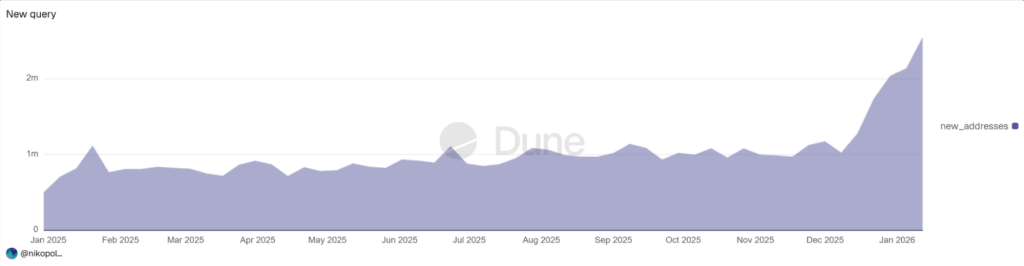
Ethereum’s network has been buzzing. Blocks are full, wallets show new activity, and on-chain counters are ticking up fast. But not all of that motion looks like real people using the chain.
Address Poisoning On The Spotlight
In a recent blog post, researcher Andrey Sergeenkov warned that a recent Ethereum upgrade is being exploited to send tiny transactions that create misleading wallet history entries, a tactic known as address poisoning.
According to the expert, a big slice of the traffic may be the result of “dusting” or address poisoning attacks. Small, almost worthless transfers — sometimes less than a dollar — are being sent to a wide range of addresses.
Record-high Ethereum activity that everyone’s celebrating is an address poisoning attack.
– Over $740K already stolen, and growing – This became possible thanks to the Fusaka upgrade – This attack is ongoing right nowhttps://t.co/cqoEvqttQd
— Andrey Sergeenkov (@Nikopolos) January 19, 2026
These tiny transfers create fake-looking entries in a wallet’s history. People who skim their recent transactions or copy addresses from a short list of past contacts can be tricked into sending funds to a scammer by mistake. It is a basic trick that gets more power when fees fall.
Why It Happened
Reports say that after recent updates and lower average gas costs, sending millions of tiny transactions became affordable. When fees drop, attackers can spray dust across large numbers of wallets and run follow-up scams at scale.
The tactic uses two steps: first, make a history entry that looks like a real counterparty; second, hope a user copies that wrong entry. Some attacks aim to deanonymize users, while others are pure bait to steal funds later.
An Ethereum wallet owner might glance at a list and use the wrong address. Or they might be prompted by a message that seems to match a past transfer. Either way, if funds are sent to the attacker, those funds are usually gone.
Reports estimate that hundreds of thousands of dollars have been siphoned from victims who fell for different versions of this trick. The sums are not always massive per case, but they add up when many victims are targeted.
Look for small incoming transfers from addresses you do not recognize, especially when those transfers appear in large batches. Watch for identical token amounts or for many transfers with the same memo or pattern.
Wallets that show sudden clusters of tiny token receipts are worth extra caution. Security tools and some wallets can hide tiny transfers or warn users about unusual incoming dust. Use those features if they are available.
What Experts AdviseBased on reports, researchers urge people to verify the full address they are sending to, not just the start or end of it. Use address book features, QR codes, or trusted contacts to confirm destinations.
Avoid copying addresses from a short recent-history view. If you receive a small, unexpected deposit, take it as a warning sign, not an invitation.
Featured image from Pexels, chart from TradingView
https://cryptoslate.com/feed/
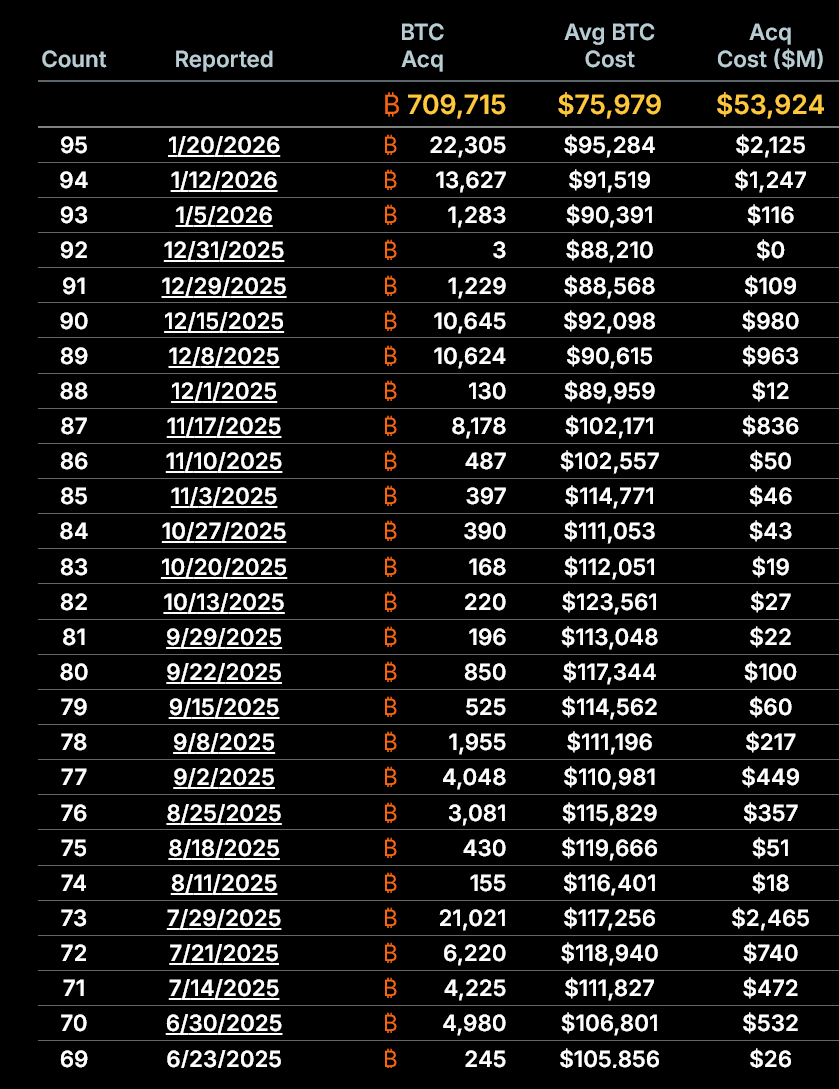
Strategy (formerly MicroStrategy) acquired an additional 22,305 Bitcoin for approximately $2.13 billion between Jan. 12 and Jan. 19, continuing an aggressive accumulation campaign that has absorbed 3.38% of the top crypto's total supply.
That works out to 3.55% of the circulating supply of 19.97 million coins.
The purchases were executed at an average price of $95,284 per bitcoin, according to a Jan. 20 8-K filing with the Securities and Exchange Commission (SEC).
The latest acquisition brings Strategy’s total Bitcoin holdings to 709,715 BTC, a hoard worth roughly $64 billion. The company’s cost basis for the total stack is approximately $53.92 billion, or an average of $75,979 per bitcoin, implying around $10.5 billion in paper gains at current prices.

How Strategy is funding its Bitcoin purchases
While the headline number highlights the company’s relentless buying, the mechanics behind the purchase reveal a significant shift in how Strategy funds its operations.
These latest acquisitions were funded using proceeds from the firm's at-the-market sales of its Class A common stock (MSTR), its perpetual Stretch preferred stock (STRC), and the Series A Perpetual Strike Preferred Stock (STRK).
 According to the SEC filing, the Michael Saylor-led Strategy sold 10,399,650 MSTR shares for approximately $1.8 billion last week. It still has about $8.4 billion worth of shares to fund future BTC purchases.
However, the preferred channel is seeing increased activity.
The filing showed Strategy sold 2,945,371 STRC shares for around $294.3 million (with $3.6 billion shares remaining) and 38,796 STRK shares for $3.4 million (with $20.3 billion shares remaining).
This increased bet shows that the company's attempt to turn its bitcoin treasury strategy into a repeatable “yield SKU” that can sit quietly in brokerage accounts and income portfolios is yielding significant interest.
Notably, this financial engineering has produced four distinct exposure tiers that trade on the Nasdaq exchange. This means investors do not need any BTC know-how to invest, as they can simply buy them through a regular brokerage account.
The product lineup is segmented by risk appetite, offering four distinct ways to play the Strategy trade.
The headline act is the Variable Rate Series A Perpetual Stretch Preferred Stock, or STRC. Marketed explicitly as “short duration high yield credit,” this security currently pays an 11.00% annual dividend in monthly cash installments.
Unlike a standard bond where market forces dictate the yield, STRC is an issuer-managed product. Strategy retains the policy power to adjust the dividend rate to ensure the stock trades near its $100 par value.
Data from STRC.live shows that the firm has accumulated 27,000 BTC from the STRC fundraiser.

Below STRC sits a tiered structure of fixed-rate perpetuals.
For the investor who wants a piece of the equity upside, there is STRK (“Strike”). It pays an 8% annual dividend and is non-cumulative (meaning missed payments are lost forever).
However, it functions as a hybrid, offering convertibility to stock that captures about 40% of the gains if Strategy’s common shares rally.
For the risk-averse income seeker, the company offers STRF (“Strife”). This 10% perpetual preferred cannot be converted to stock, but it sits higher in the capital structure.
It is cumulative, meaning the company must make up any missed dividend payments later. With $1.6 billion remaining in capacity, it represents the most conservative tier.
There is also the STRD (“Stride”) instrument, which matches the 10% yield of STRF but removes the safety net. It is non-cumulative and non-convertible.
If Strategy skips a payment, the investor has no recourse, giving STRD the sharpest risk-reward profile among the fixed-rate options. It has $1.4 billion remaining.
Meanwhile, the company has even opened a European front. Last November, Strategy introduced the Series A Perpetual Stream Preferred (STRE), a euro-denominated security that carries a 10% annual dividend paid quarterly.
This instrument carries sharp teeth regarding non-payment. The dividend is cumulative and increases by 100 basis points per missed period, up to a maximum of 18%.
Institutional investors turn to Strategy's preferred
Strategy's financial engineering product list has successfully courted a demographic that typically shuns crypto: the income tourist.

Data from several institutional filings show that high-income and preferred-focused funds are populating the STRC holders list. The roster includes the Fidelity Capital & Income Fund (FAGIX), Fidelity Advisor Floating Rate High Income (FFRAX), and the Virtus InfraCap U.S. Preferred Stock ETF (PFFA).
Meanwhile, the most striking validation comes from BlackRock. The BlackRock iShares Preferred and Income Securities ETF (PFF) is a massive fund that tracks an index usually dominated by sleepy bank and utility preferreds.
As of Jan. 16, the fund held $14.25 billion in net assets. Inside that conservative portfolio, Strategy’s Bitcoin-linked paper has established a beachhead.
The ETF disclosed a position of approximately $210 million in Strategy’s STRC. It holds another ~$260 million across STRF, STRK, and STRD. In total, BlackRock’s ETF exposure to Strategy preferreds sits at roughly $470 million (or 3.3% of the total fund).
Valentin Kosanovic, a deputy director at Capital B, views this as a watershed moment for digital credit.
According to him:
“This is another clear, factual, unquestionable demonstration of the materialization of the wave of institutionalized legacy BTC-pegged financial products.”
Risks?
The machinery required to sustain these dividends creates a unique set of risks. Strategy is not paying these yields from operating profits in the traditional sense. It is funding them through the capital markets.
The company’s prospectus for STRC states that cash dividends are expected to be funded primarily through additional capital raising, including at-the-market stock offerings.
This creates a circular dependency: Strategy sells securities to buy Bitcoin and then pays dividends on those securities.
Considering this, Michael Fanelli, a partner at RSM US, highlighted several risks associated with this model, including Bitcoin price crashes, the lack of insurance coverage, and the fact that the products are unproven in recessions. He also noted that the perpetual products have no maturity date.
However, Bitcoin analyst Adam Livingston countered that the products are a “mind-bender” for traditional analysts. He argued that “STRC is quietly turning Strategy into a private central bank for the yield-starved world.”
According to him:
“STRC is a coupon-bearing ‘credit rail’ that can absorb fixed-income demand, convert it into BTC at scale, then feed the equity premium that makes the next raise easier, cheaper, and faster. That is a flywheel with a bid inside it.”
The post Strategy just crossed 700k BTC but its “circular” Bitcoin funding loop risks a massive high-yield credit disaster appeared first on CryptoSlate.
Analog January is meeting Bitcoin at the custody layer as some investors seek exposure without screen time.
The digital-minimalism push, framed as “tech-low and slow living,” is landing as crypto returns to a volatility regime that makes constant checking expensive.

Livingetc reported that “Analog January” (sometimes shortened to “Janalog”) is a reset from compulsive micro-checking rather than a move off-grid, quoting productivity specialist Emily Austen in a piece published Jan. 7, 2026.
In parallel, markets swung through a liquidation cascade, with 24-hour liquidations at $874 million and Bitcoin peaking near $95,000 before reversing as major tokens opened lower.
The overlap between a “check less” cultural reset and a “move fast” trading tape is turning custody into a lifestyle variable.
Investors already have tools that reduce attention, such as index funds or ETF wrappers, but most crypto interfaces still nudge users toward prices, alerts, and leverage.
Bitcoin is unusual among widely traded assets because its low-touch mode is not a platform feature; it is a custody choice.
Holders can self-custody in cold storage, keep keys off connected devices, and verify ownership without maintaining a perpetual account relationship with a broker or exchange.
That makes it legible as an “anti-screen” store-of-value posture in a way that looks closer to a vault than an app.
What this means for adoption, culture, and the next phase of crypto infrastructure
ETF flows show the other side of the same behavior, reducing touchpoints by delegating custody and execution.
Spot Bitcoin ETFs saw $394.7 million of net outflows yesterday, while spot Ethereum ETFs recorded $4.64 million of net inflows.

The figures do not map one-to-one to on-chain transfers, but they show that “set-and-forget” can mean convenience through regulated wrappers just as easily as sovereignty through keys.
They also show flows can pivot even during a culture moment built around stepping away from screens.
Hardware wallets sit at the center of the offline custody pathway, and the market is scaling beyond early-adopter cycles.
According to Mordor Intelligence, the hardware wallet market is valued at $0.56 billion in 2026, estimated at $0.72 billion by the end of the year, and forecast to reach $2.58 billion by 2031.
That implies a 29.05% compound annual growth rate from 2026 through 2031.

The trajectory suggests supply chains, retail distribution, and support infrastructure that can absorb demand bursts when volatility or security headlines push users toward cold storage, rather than constraining adoption to specialist circles.
| Metric | Figure | Timeframe |
|---|---|---|
| Liquidations | $874.01M | 24 hours |
| Spot Bitcoin ETF net flow | -$394.7M | Same window |
| Spot Ether ETF net flow | +$4.64M | Same window |
| Hardware wallet market | $0.72B | 2026 estimate |
| Hardware wallet market | $2.58B | 2031 forecast |
| Crypto stolen | $2.2B | H1 2025 |
| Thefts targeting individuals | 23% | H1 2025 |
Security is the other structural driver for going offline
The Financial Times reported demand for secure crypto devices as hacks hit record levels, citing Chainalysis data that $2.2 billion was stolen in the first half of 2025, with 23% of thefts targeting individual wallets.
The report also noted that Ledger’s revenue reached “triple-digit millions” in 2025.
Beyond hacks and phishing, crypto holders are increasingly facing real-world violence designed to bypass even the strongest wallet security. These incidents, often referred to as “$5 wrench attacks,” involve criminals using threats, kidnapping, home invasions, or torture to force victims to hand over seed phrases or authorize on-chain transfers, which are typically irreversible once sent.
CryptoSlate has reported on a growing pattern of attacks across 2024 and 2025, including cases where victims were specifically targeted after their identities, addresses, or holdings were exposed through data leaks or doxxing, and even situations where attackers posed as delivery workers to gain access.
The rise in these crimes is pushing some high-net-worth investors to adopt more aggressive personal security measures and rethink how publicly they discuss crypto wealth, because in the self-custody era, the weakest link is often no longer the code, but the person holding the keys.
For this reason, wallets that allow multiple accounts with separate PIN codes are preferred, as they allow holders to create “distress” or “honey-pot” wallets to avoid losing everything in the event of a physical attack. Users split holdings across distinct pin codes to be compliant with attackers without giving the keys to every sat.

That backdrop turns self-custody from an identity choice into an operational choice because the attack surface for individuals sits at the intersection of always-connected devices, phishing vectors, and hurried transaction signing.
Whether the analog mood is converting into custody behavior can be tracked with public indicators that move faster than quarterly surveys.
Google’s Trends' Trending Now experience uses a forecasting engine that refreshes every 10 minutes, allowing short-window comparisons between terms tied to digital fatigue (“Analog January,” “digital detox”) and terms tied to offline security (“hardware wallet,” “cold storage,” “seed phrase”).
Past the attention layer, intent can be watched through exchange-balance proxies
CryptoQuant’s Exchange Reserve is defined as the total coins held on exchanges, a series market participants often use as a proxy for potential sell-side inventory and post-shock transfers into longer-term storage.
Volatility can also be anchored in a forward-looking measure rather than spot swings.
According to CF Benchmarks, the CME CF Bitcoin Volatility Index (BVX) is a 30-day constant-maturity implied volatility measure derived from CME Bitcoin and Micro Bitcoin options.
When implied volatility reprices, hedging costs, and the day-to-day friction of monitoring positions reprice with it, which is where a “check less” habit and “hold offline” tools can converge into observable shifts in custody and flow.
Bitcoin fits the ‘Analog January' mindset more cleanly than most large-cap tokens because its store-of-value framing maps onto cold storage workflows.
Ethereum can still see the same custody reflex, especially for holders who want safer transaction signing, even if its usage narrative is tied to application interaction.
XRP is closer to rails, where an “anti-screen” posture leans toward automation and settlement rather than vault storage, even when broader risk-off conditions hit multiple tokens at once.
The post Analog January has people worldwide quietly moving offline, and the biggest Bitcoin risk isn’t price volatility appeared first on CryptoSlate.
https://ambcrypto.com/feed/
 The altcoin market extended its sell-off as the total crypto market cap excluding Bitcoin dropped to around $1.2 trillion.
 As ROSE rallied 105%, traders watched whether infrastructure demand could sustain momentum.
https://beincrypto.com/feed/
Strategy (formerly MicroStrategy) made its most substantial Bitcoin purchase since November 2024, just a day before Bitcoin’s price dropped below the $90,000 threshold.
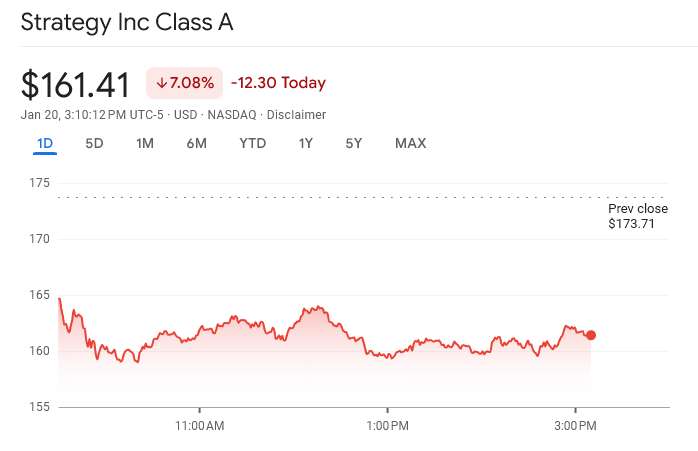
Despite the company’s consistent commitment to its aggressive accumulation playbook, Strategy’s shares dropped by over 7%.
Strategy’s Biggest Bitcoin Buy Since 2024
On Tuesday, Strategy announced the acquisition of 22,305 Bitcoin for approximately $2.13 billion, bringing its total Bitcoin holdings to 709,715.
The transaction, which was carried out on Monday, marked Strategy’s largest Bitcoin purchase since November 2024. It also followed two additional acquisitions completed earlier in January, reaffirming the company’s continued commitment to expanding its Bitcoin treasury.
Despite the scale of the latest purchase, market reaction remained muted. Similar to the acquisition announced last Monday, the move failed to bolster investor confidence in Strategy’s long-term outlook.
Over the past 24 hours, the company’s shares declined 7.39%, with MSTR trading at $160.87 at the time of writing.
The company’s approach to timing its Bitcoin purchases has also drawn scrutiny.
Bitcoin Accumulation Continues Despite Market Weakness
According to Monday’s disclosure, Strategy paid an average price of $95,284 per Bitcoin. Yet on the same day, Bitcoin was trading near $92,500 and briefly fell below $90,000 the following day.
The timing highlighted a recurring pattern in which Strategy has failed to capitalize on short-term price declines.
In December, BeInCrypto reported that the company spent nearly $1 billion to acquire 10,624 Bitcoin. Although Bitcoin had dropped to around $86,000 at the time, Strategy executed the purchase after the price rebounded to approximately $90,615.
This approach has raised ongoing questions about the firm’s entry-point strategy and its apparent willingness to accumulate Bitcoin at elevated price levels rather than during market pullbacks.
It has also done little to ease shareholder concerns about its broader capital allocation decisions.
Despite a modest recovery over the past month, Bitcoin has been unable to reclaim the $100,000 level. At the same time, growing analyst concerns about a potential bear market have heightened uncertainty about the asset’s near-term price outlook.
Against this backdrop, Strategy has continued to press ahead with its accumulation plan.
While the approach is intended to signal confidence in Bitcoin’s long-term prospects, it has so far done little to alleviate investors’ short-term concerns.
The post MicroStrategy’s Largest Bitcoin Purchase in a Year Shakes Stock Market Confidence appeared first on BeInCrypto.
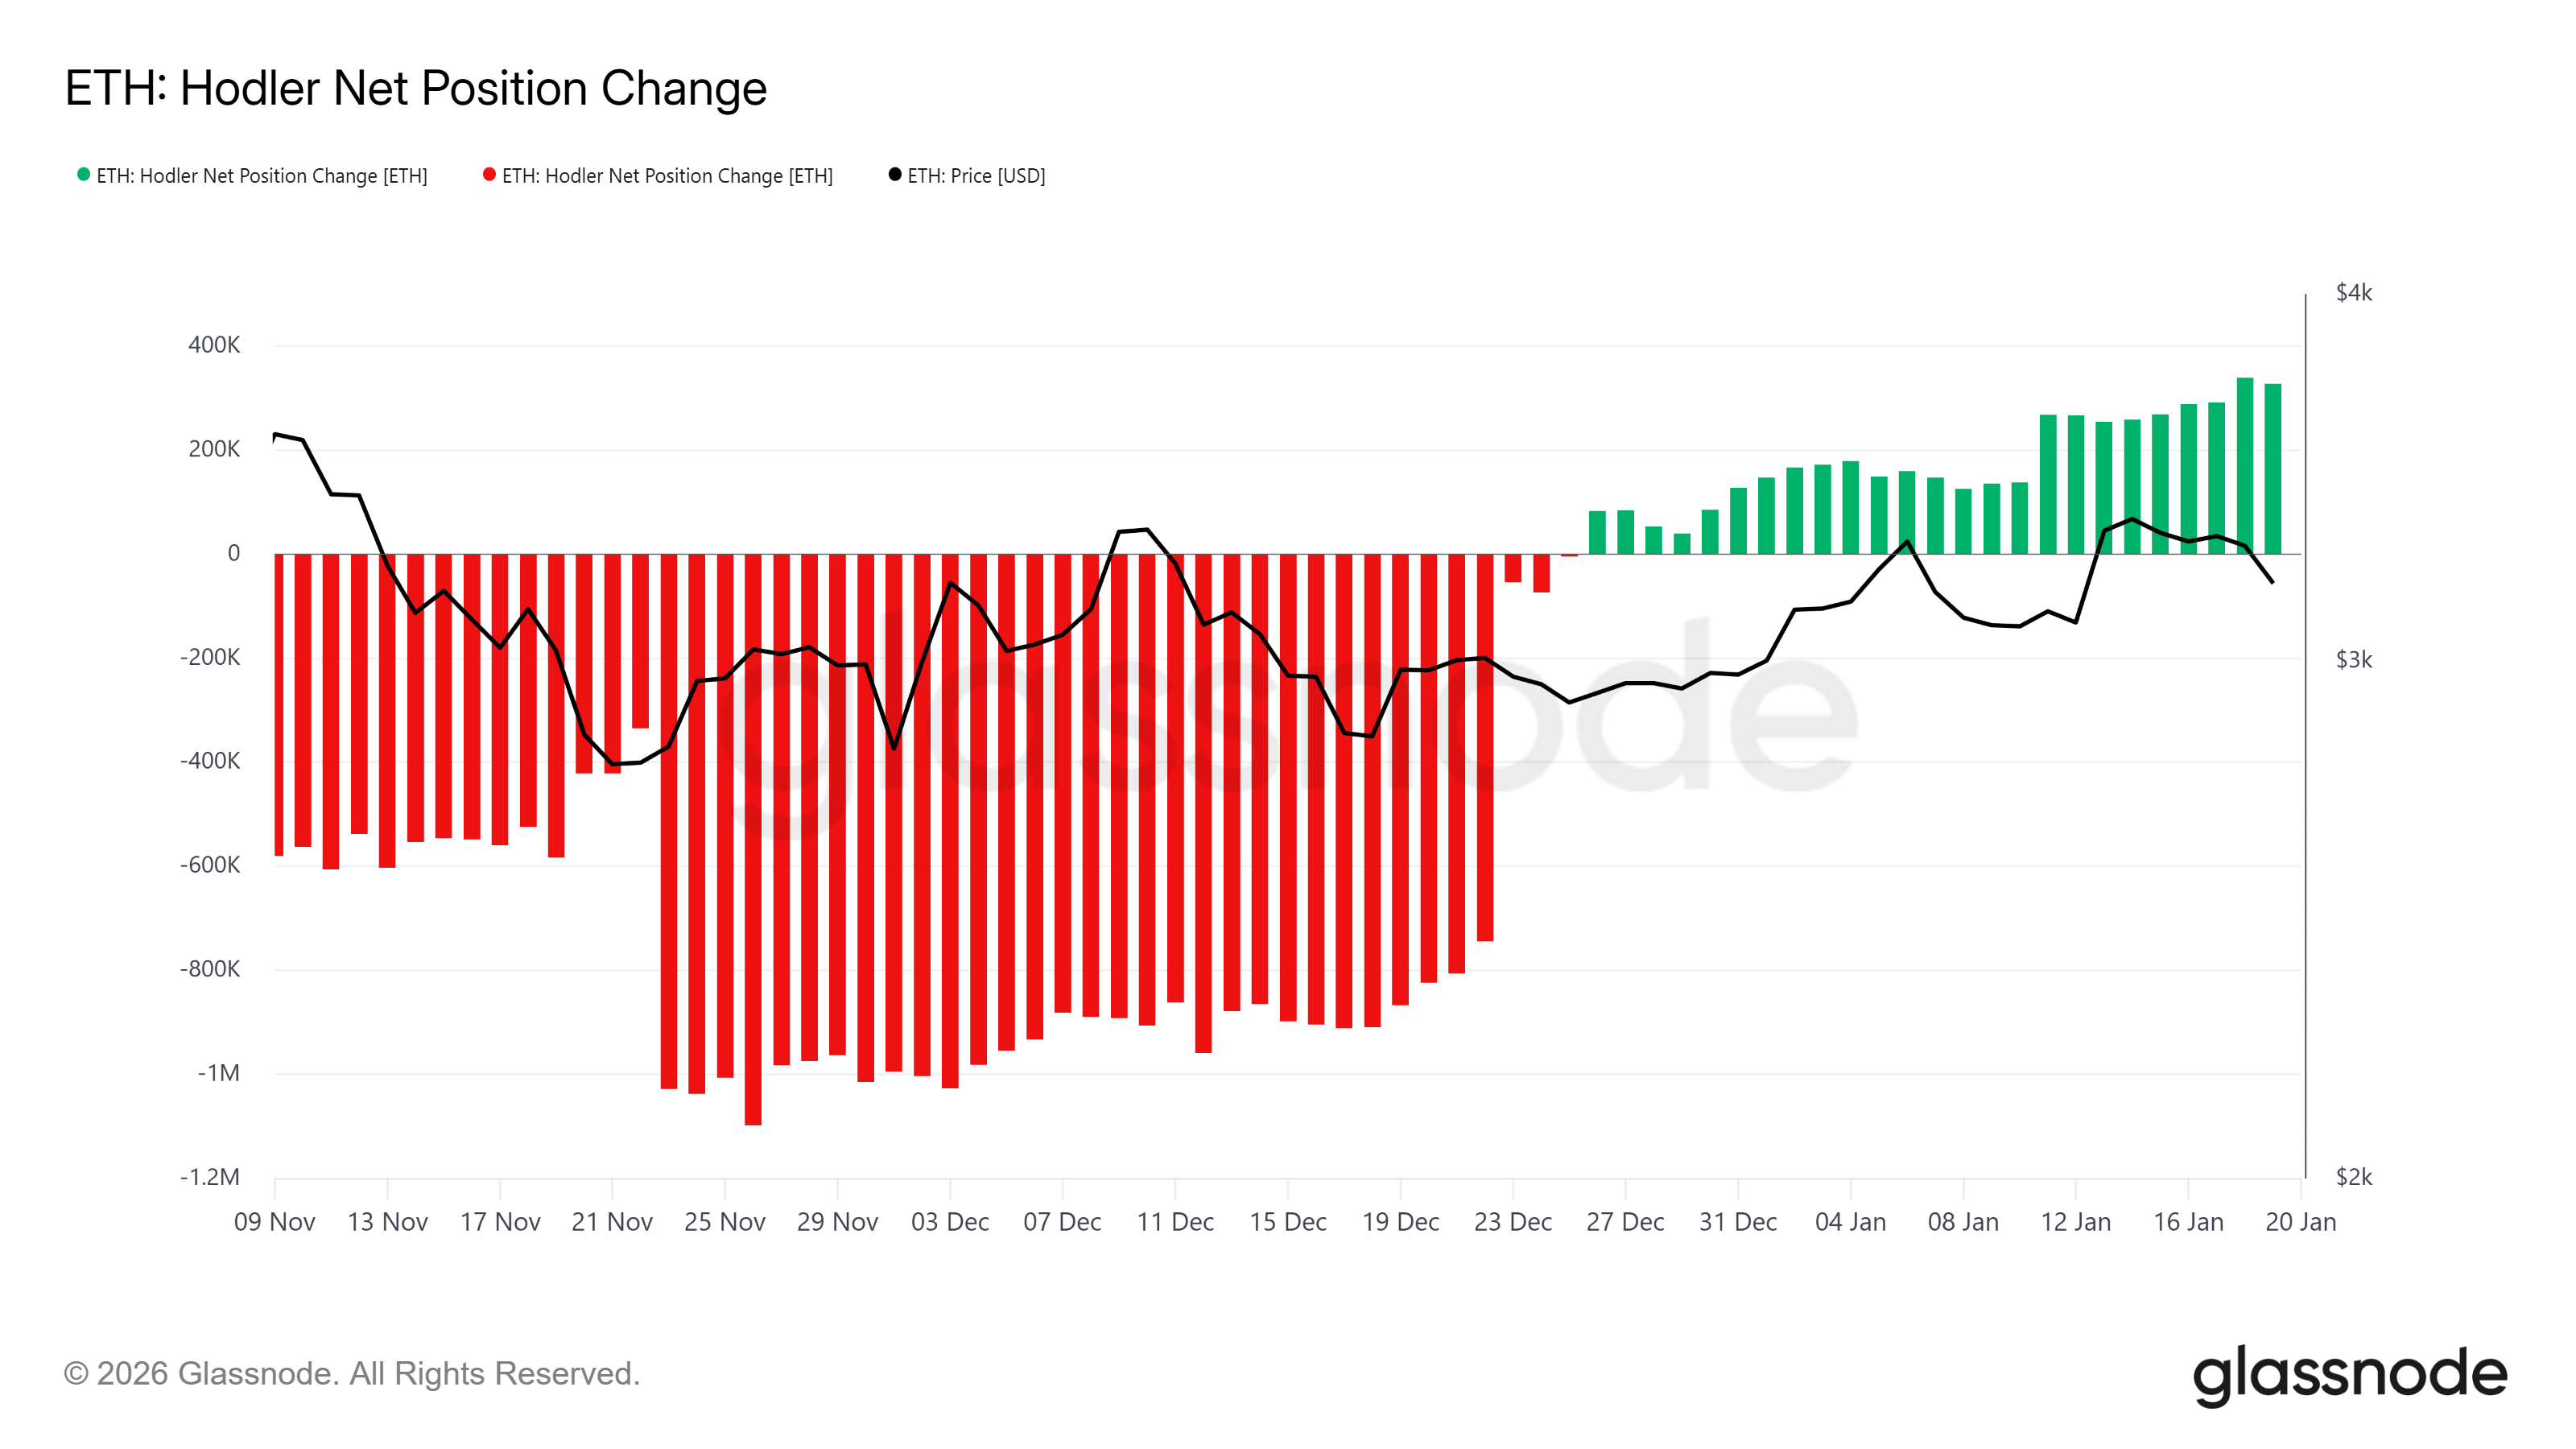
ETH is starting to roll over after failing to hold above key resistance, and the tape is turning heavy. Price has broken back down after an early-month push higher, putting a bearish structure back in play.
While longer-term holders are still providing some support, growing sell-side pressure and weak broader market conditions are putting that bid to the test.
Can Ethereum LTHs Prevent A Breakdown?
On-chain data shows long-term Ethereum holders are still largely in accumulation mode. The HODLer Net Position Change has printed steady green bars since late December, signaling reduced distribution and continued accumulation from stronger hands. This behavior has helped cushion recent pullbacks and slow downside momentum.
That said, even sticky LTH demand can get overwhelmed if macro and derivatives pressure keep building. If risk-off sentiment persists, long-term support alone may not be enough to prevent a deeper flush.
Want more token insights like this? Sign up for Editor Harsh Notariya’s Daily Crypto Newsletter here.
Ethereum Bulls Face Further Losses
The ETH derivatives market is flashing warning signs. Futures positioning is heavily skewed short, with over 83% of open exposure leaning bearish. This kind of imbalance tends to amplify volatility once the price starts moving, especially near major psychological levels.
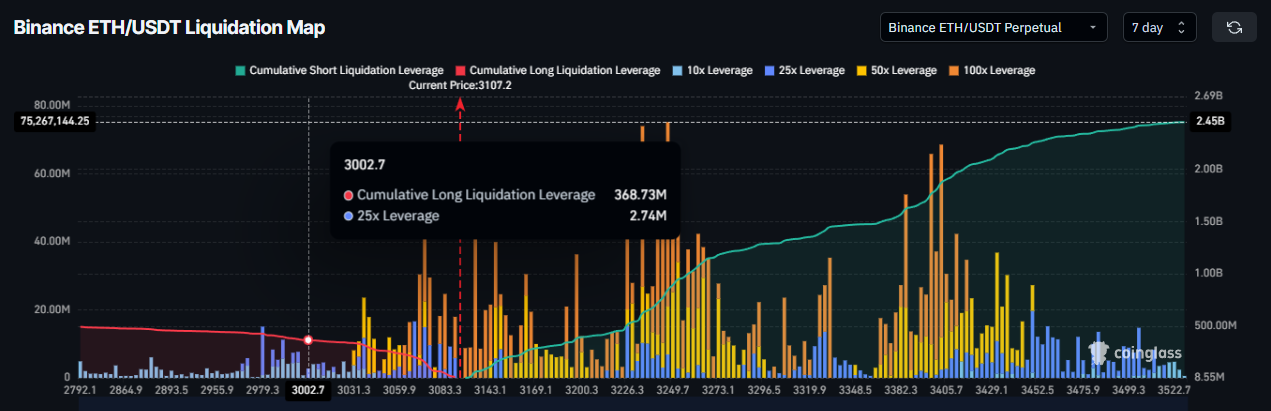
Liquidation data shows a clear danger zone around $3,000. A push into that area could trigger roughly $368 million in long liquidations. If those get forced, downside momentum could accelerate quickly as bullish positioning gets wiped out.
Ethereum Selling Pressure Continues To Strengthen
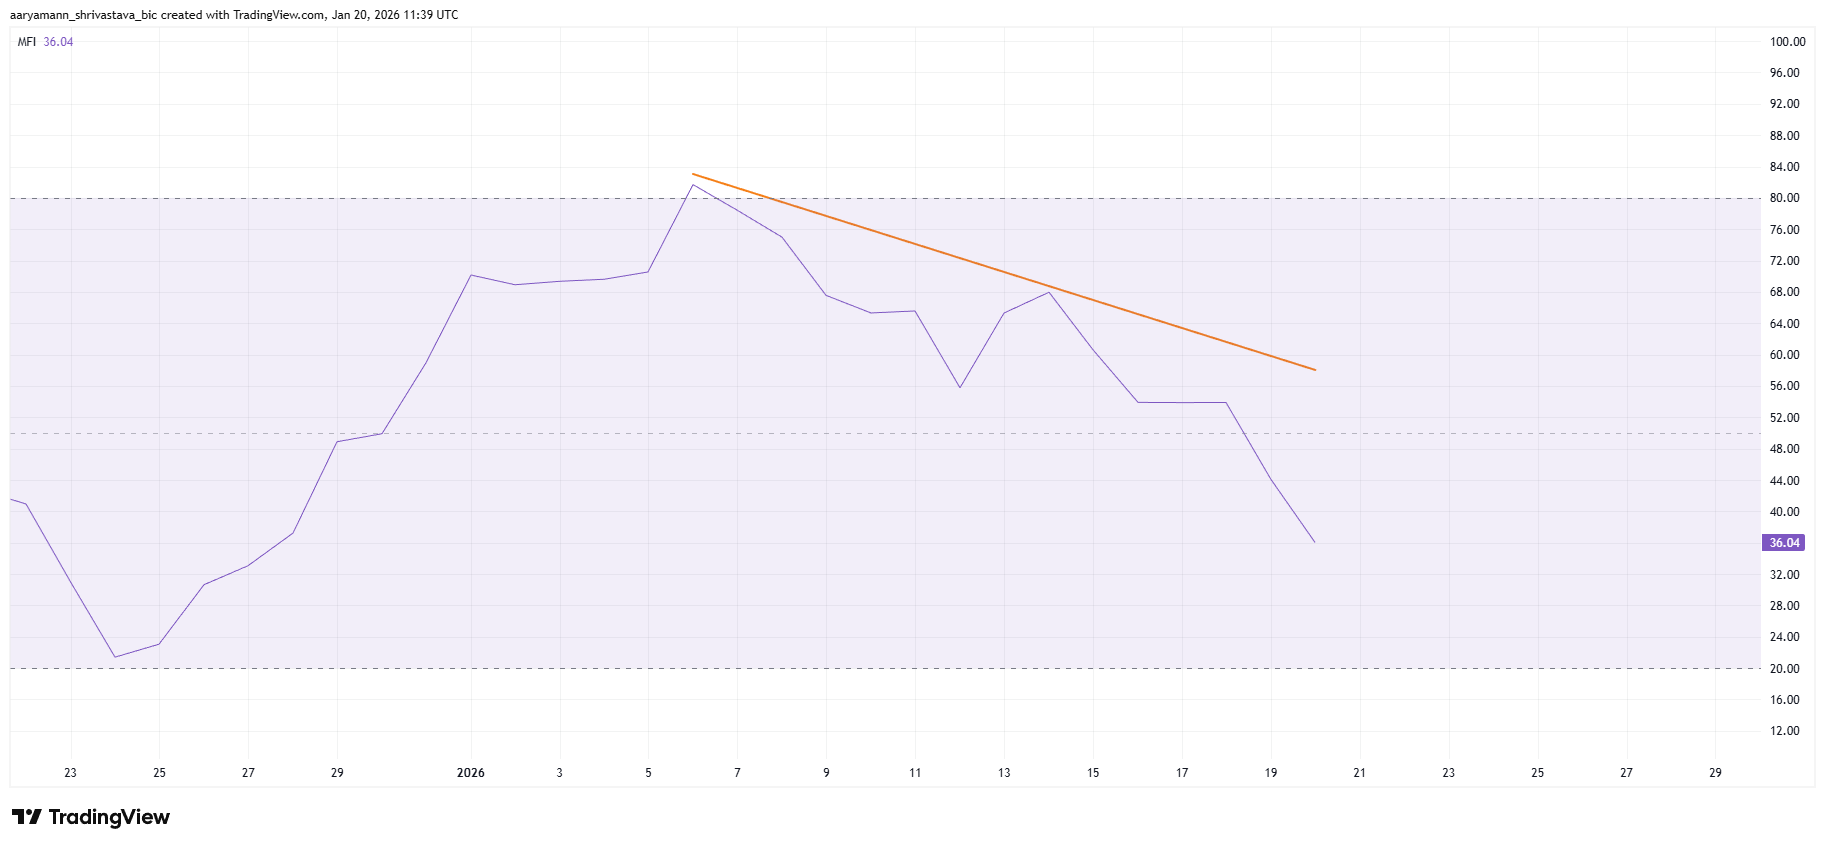
Momentum indicators back up the bearish read. The Money Flow Index has slipped below the 50 midline, signaling capital is rotating out. After briefly tagging overbought earlier this month, ETH has seen buying pressure fade steadily.
A declining MFI usually means sellers are in control until proven otherwise. Until flows stabilize or flip back positive, Ethereum’s price remains vulnerable to further downside.
ETH Price Crash Below $3,000 Likely
Ethereum price trades near $3,109 at the time of writing. The 12-hour chart shows a developing double top pattern, a bearish formation. This setup projects a potential 7.5% decline, targeting a move toward the $2,900 level if confirmed.
Technical and on-chain factors support this downside scenario. Losing the $3,085 support would confirm the breakdown. Selling pressure could intensify once ETH slips below the $3,000 psychological level, where liquidation risk rises sharply, and bullish defenses weaken.
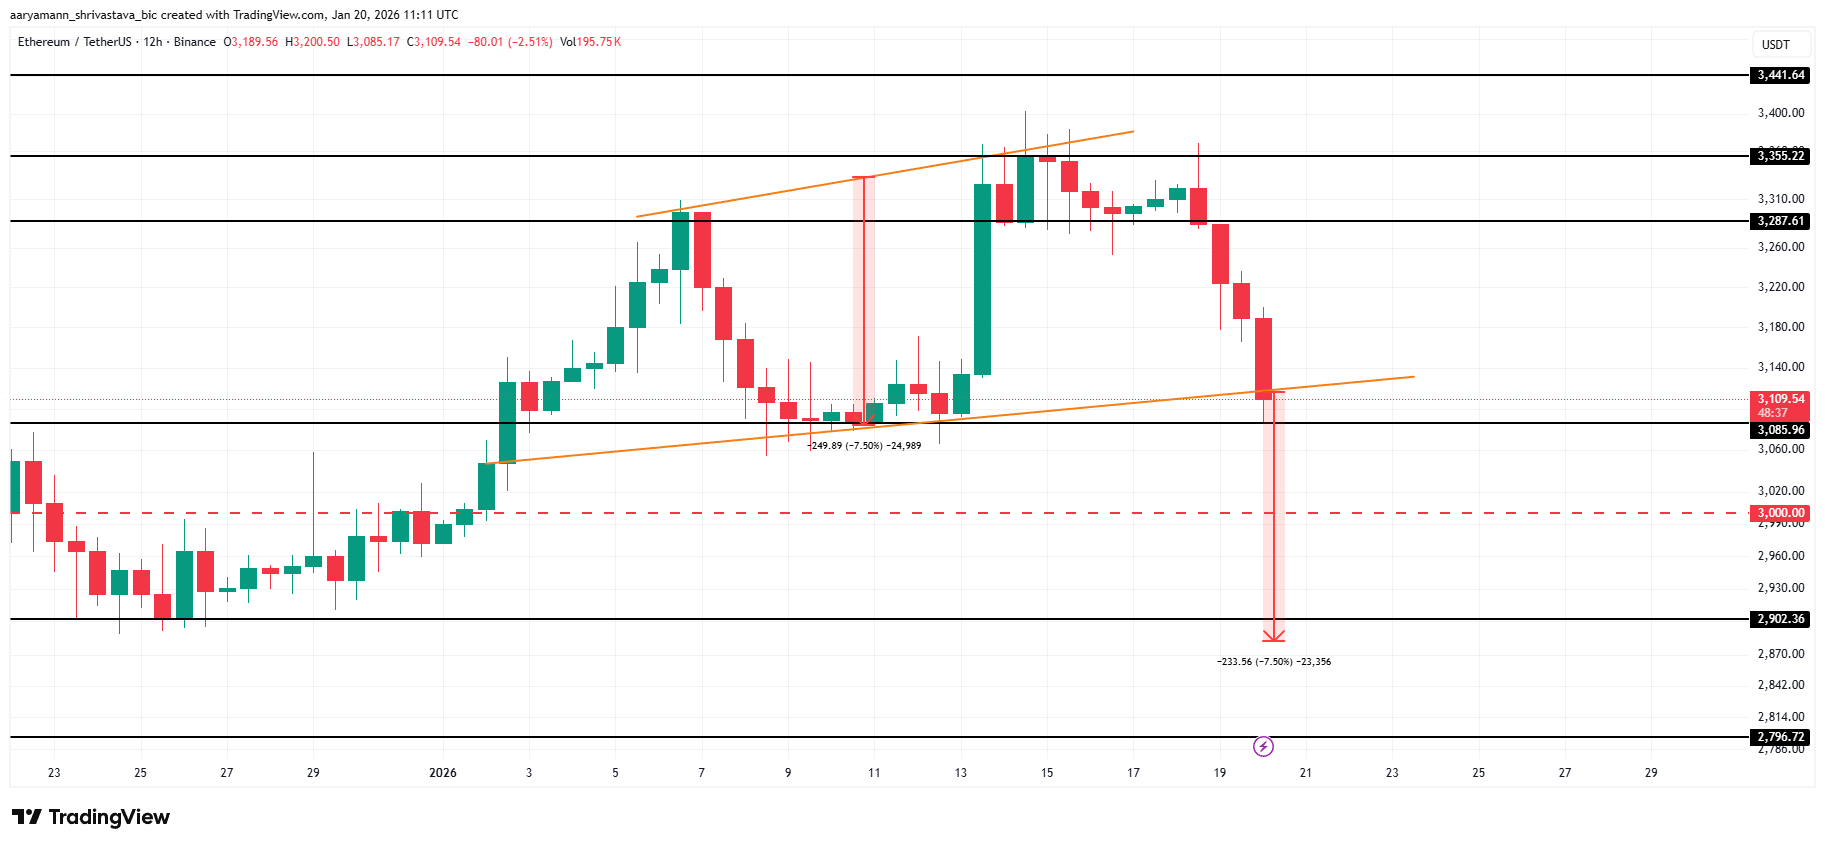
A bullish reversal remains possible if long-term holders maintain control. A successful bounce from $3,085 could restore confidence. Under that scenario, Ethereum may attempt a recovery toward $3,287. Reclaiming that level would invalidate the bearish thesis and signal renewed demand.
The post Ethereum Price at Risk: Selling Pressure Signals Possible Drop Below $3,000 appeared first on BeInCrypto.
https://cryptonewsz.com/feed/
https://www.newsbtc.com/feed/
Ethereum is trying to stabilize above the $3,100 level after failing to break the $3,400 resistance, as the broader crypto market struggles to recover momentum. While bulls managed to defend key support in recent sessions, price action remains fragile and highly reactive, with sellers still showing up on rallies. ETH is stuck in a tight range, and traders are watching closely to see whether this pullback turns into a deeper correction or simply a reset before the next move higher.
A report from Arab Chain highlights that Binance data is signaling a sensitive phase for Ethereum at the start of 2026. According to the analysis, ETH is trading near the $3,200 zone, but market flow conditions remain tilted to the downside.
The Accumulated Order Flow (CVD) indicator sits at approximately -3,676, suggesting that net selling pressure is still dominating short-term activity. In simple terms, more aggressive sell orders are hitting the market than buy orders, even as price attempts to hold recent levels.
This divergence between price stabilization and negative flow reflects a market that is not collapsing, but also not attracting strong demand yet. As Ethereum defends support, the next test will be whether buyers can reclaim $3,300 and challenge the $3,400 ceiling again, or if weakness drags price back toward deeper support zones.
Ethereum Holds Despite Negative Binance Order Flow
Arab Chain notes that even though Ethereum’s CVD remains negative, the relationship between price and liquidity flows is not fully broken. According to the report, the 30-day correlation between ETH price and CVD sits near 0.62, which is a relatively constructive reading. This pattern suggests that price action partially aligns with volume behavior, even though liquidity currently tilts toward selling rather than fresh buying.
In other words, Ethereum is not trading in a vacuum—flows still matter—and the market is reacting in a way that reflects real positioning.

From a broader perspective, ETH’s gradual decline to its current levels signals a correction phase following its previous upside surge. Historically, this is the type of environment where short-term investors take profits and reduce exposure, while larger players begin to rebalance portfolios and slowly rebuild positions. Instead of an immediate trend reversal, the market often transitions into sideways price action as both sides test liquidity.
The key issue is that CVD remains negative, meaning demand has not yet become strong enough to flip the short-term flow structure. However, Ethereum’s ability to hold above the $3,000 level points to underlying support that is limiting downside acceleration.
This mismatch—weak momentum in volume flows but stable price behavior—often precedes quieter consolidation periods that can later set the foundation for stronger upside once liquidity conditions improve.
EETH Bulls Fight to Reclaim $3,100
Ethereum is trying to stabilize above the $3,100 level after a sharp rejection from the $3,400 supply zone, with price now trading near $3,111. The chart shows ETH still recovering from the broader downtrend that started after the November breakdown, but the structure remains fragile as sellers continue defending every attempt to push higher.

From a technical perspective, the $3,300–$3,400 region stands out as the key resistance cluster. Price has repeatedly failed in this area, and the latest rejection confirms it remains a major distribution level. At the same time, Ethereum is holding above its short-term moving average near $3,050–$3,100. Suggesting buyers are still active, defending the current range.
However, ETH remains capped below the mid-term moving averages, which are trending lower and acting as dynamic resistance. This keeps the market in a “recovery inside a downtrend” setup unless bulls can flip those levels back into support. Volume has also remained relatively muted during the rebound, signaling that the move still lacks aggressive follow-through.
Ethereum appears stuck in consolidation. With $3,000 as the critical floor and $3,400 as the breakout trigger needed to shift market sentiment.
Featured image from ChatGPT, chart from TradingView.com
XRP’s next big rise could come with hardly any warning, traders and analysts warn. Markets are quiet now. That quiet has happened before, and it has sometimes been followed by sharp moves that catch most people off guard.
History Of Sudden Moves
According to several community analysts, XRP has a pattern of long quiet periods followed by fast spikes. It rarely creeps steadily upward for weeks before a charge. Instead, price often treads water, people lose faith, and then momentum arrives quickly.
That behavior has left many short-term traders on the sidelines when runs happen. A move looks obvious only after it is already well under way.
Legal Overhang Gone
Reports say the SEC lawsuit changed XRP’s timing for years. While other tokens took part in big market swings, XRP traded under heavy regulatory pressure. That pressure is now removed.
The major $XRP breakout will come when many least expect it. Its always a “catch-off-guard” move.. but we’re prepared.
—
ChartNerd
(@ChartNerdTA) January 17, 2026
The market has since been allowed to price XRP without that cloud. In late 2024, a notable rally began after US President Donald Trump’s win and the exit of SEC Chair Gary Gensler. Momentum pushed XRP from roughly $0.50 to above $3 in a matter of weeks. But the gains were followed by a long reset.
Exposure Beats Perfect TimingAccording to a number of commentators, being already invested matters more than hitting the exact bottom. When the price starts to climb fast, buyers who jump in late often pay too much and panic-sell when the heat fades.
Early holders tend to capture most of the upside. Reports note this has repeated across multiple cycles. Emotion drives late entry; calm positioning often wins.
At the time of writing, XRP was trading near $1.93, down about 4% on the day and roughly 55% below its recent high. Many who bought above $3 over the past year have cut losses or reduced positions, which has left sentiment thin.
On Quick Inflows & Short-Term SqueezeLiquidity in key ranges is lighter than traders might assume. Volume patterns and derivatives flows will matter if price begins to move again.
An array of factors could start the run — quick inflows, a shift in macro appetite, or a big buyer showing up. On-chain signs, exchange flows, and futures positioning would give clearer clues, but those signals can flip fast.
Featured image from Unsplash, chart from TradingView


